

Has Globalstar’s 133% Share Price Surge Made It Too Expensive in 2025?
- Wondering if Globalstar’s rapid rise means the stock is now a hidden gem or if it is already too rich for your portfolio? You are not alone. Many investors are watching its valuation closely.
- The share price has increased 133.1% over the past year and is up 98.0% year-to-date, with a surge of 41.2% in just the last month. This suggests a significant change in market sentiment.
- Much of this momentum can be linked to recent headlines about the company’s technology partnerships and expanding satellite network, which have boosted optimism about future growth. Investors are also responding to increased discussion about Globalstar’s role in supporting next-generation connectivity solutions.
- Despite all the excitement, Globalstar currently scores 0 out of 6 in our valuation checks. This raises questions about whether the price is supported by the company's underlying value. Here is a look at how analysts measure value in this context, and there is a suggestion for a smarter approach to cut through the noise at the end of the article.
Globalstar scores just 0/6 on our valuation checks. See what other red flags we found in the full valuation breakdown.
Approach 1: Globalstar Discounted Cash Flow (DCF) Analysis
A Discounted Cash Flow (DCF) model estimates a company's fair value by projecting its future cash flows and discounting them back to today’s value. For Globalstar, this means analyzing how much cash the company is expected to generate over the coming years and converting those projections into today’s dollars.
Globalstar’s latest twelve-month free cash flow stands at $443.6 million, with analysts projecting this figure to reach $212.6 million in 2027. Beyond 2027, estimates are extrapolated based on trends from recent analyst forecasts, continuing through 2035. Over this period, projections show that free cash flow may fluctuate, starting at $149.5 million in 2026 and settling around $98.3 million by 2035. The DCF model aggregates these projections to calculate an intrinsic value per share.
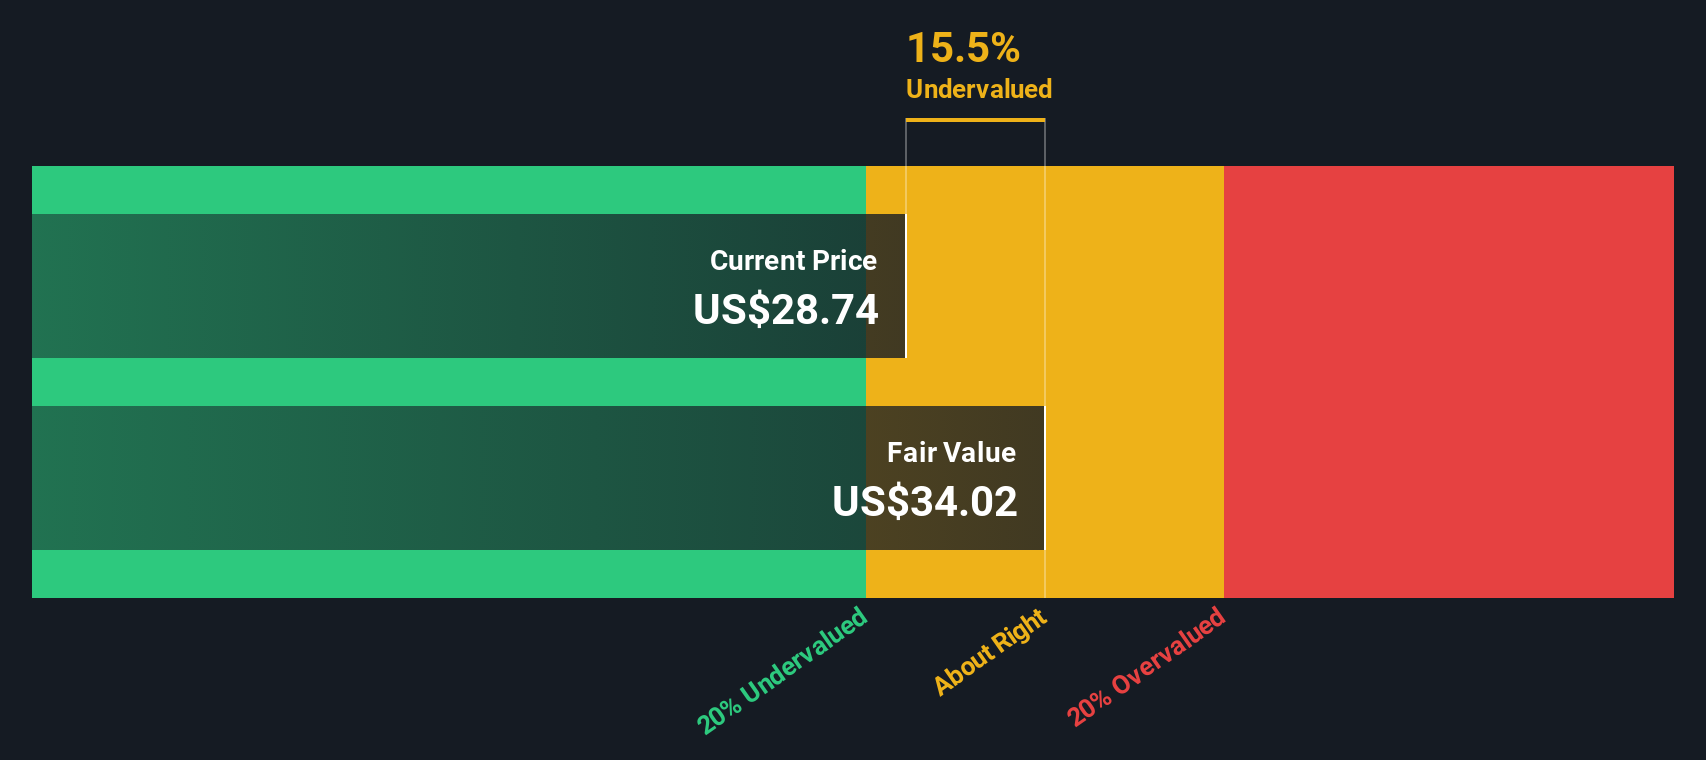
Based on this two-stage DCF methodology, Globalstar's estimated fair value is $18.32 per share. When compared to its recent market price, the model suggests that Globalstar is trading at a substantial premium. Specifically, it is 243.7% above its intrinsic value. In simple terms, this valuation implies that the stock is significantly overvalued when assessed on a cash flow basis.
Result: OVERVALUED
Our Discounted Cash Flow (DCF) analysis suggests Globalstar may be overvalued by 243.7%. Discover 878 undervalued stocks or create your own screener to find better value opportunities.
Approach 2: Globalstar Price vs Sales
The Price-to-Sales (P/S) ratio is a widely used metric for valuing companies, especially those that are not consistently profitable but are generating meaningful revenue. For a business like Globalstar, where bottom-line profits may be volatile or negative due to investment in future growth, sales-based multiples provide a clearer sense of how the market values the company's current revenue streams compared to its peers.
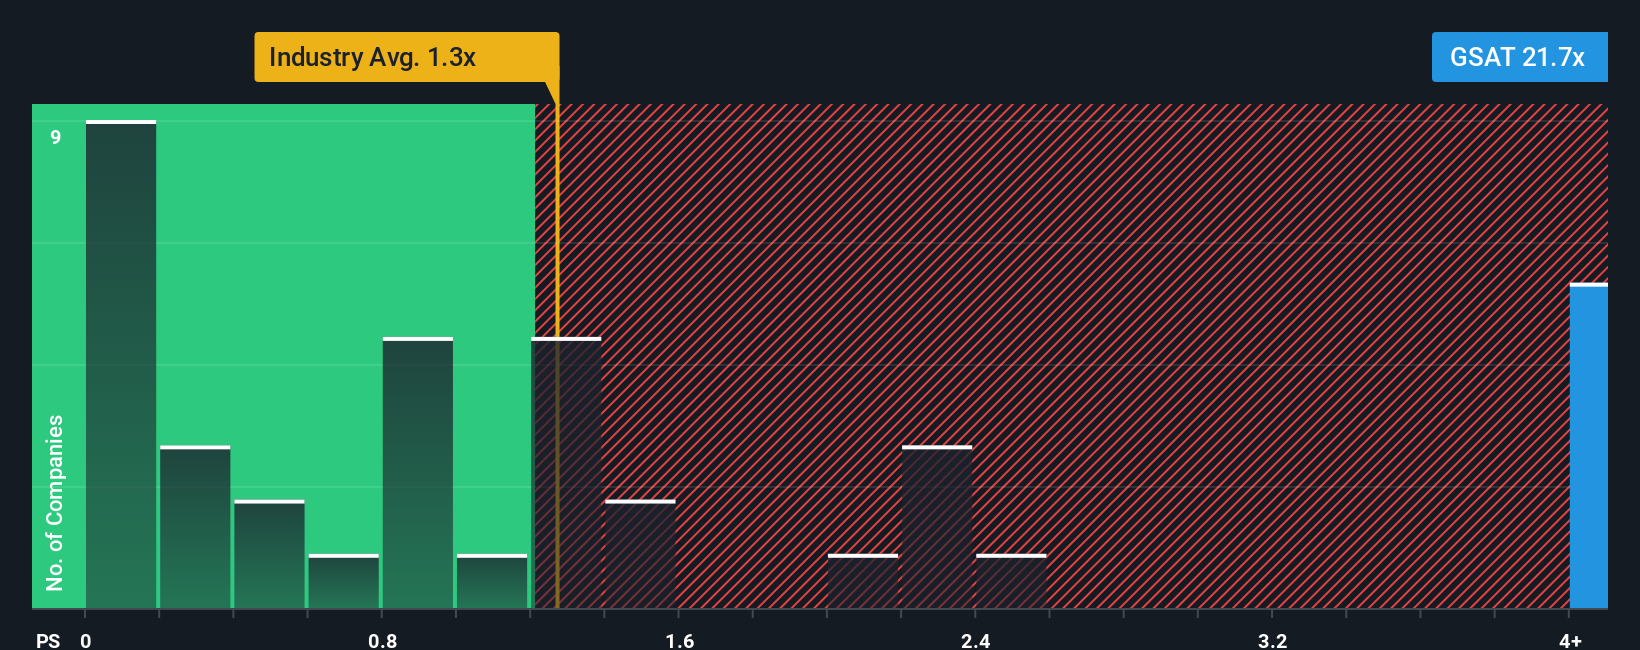
Typically, higher P/S ratios are justified for companies with strong growth prospects or unique technologies. Riskier or slower-growing companies tend to trade closer to industry norms. Investors often look at both industry averages, which for telecom sits at about 1.18x, and the average of Globalstar’s direct peers, which is 1.08x. However, Globalstar’s own P/S ratio comes in dramatically higher, at 30.45x.
Simply Wall St’s “Fair Ratio” goes further by estimating what multiple would be objectively justified for Globalstar, factoring in the company’s growth outlook, risk profile, profit margins, industry sector and market cap. In Globalstar’s case, its Fair Ratio is calculated at 2.07x. This method is preferable to simply comparing against an industry or peer group, as it provides a more tailored assessment of the company’s unique positioning and potential.
Comparing Globalstar’s actual P/S ratio of 30.45x with its Fair Ratio of 2.07x suggests the stock is valued well above what would be reasonably justified given its characteristics.
Result: OVERVALUED
PS ratios tell one story, but what if the real opportunity lies elsewhere? Discover 1405 companies where insiders are betting big on explosive growth.
Upgrade Your Decision Making: Choose your Globalstar Narrative
Earlier we mentioned that there is an even better way to understand valuation, so let’s introduce you to Narratives. A Narrative is simply the story or perspective investors bring to a company: your view on its potential, future revenue, earnings, and what you believe is a fair value, grounded in the numbers but driven by your assumptions about where the business is headed.
With Narratives, you connect Globalstar’s business story (like spectrum expansion or new government partnerships) to your own financial forecasts, and that lets you estimate a fair value per share that reflects your unique outlook. Narratives are an easy, accessible tool right on Simply Wall St’s Community page, used by millions, letting you quickly compare your own fair value calculation with the latest share price and adjust as new news or earnings are released.
This helps you decide if you think Globalstar is “overpriced” or “a bargain” in real time. For example, the most optimistic Globalstar Narratives set a fair value as high as $66 per share, while the most cautious assign it at $45, capturing a wide range of views based on differences in revenue growth, profit margins, and industry outlook. All of these are updated dynamically whenever new data arrives.
Do you think there's more to the story for Globalstar? Head over to our Community to see what others are saying!

This article by Simply Wall St is general in nature. We provide commentary based on historical data and analyst forecasts only using an unbiased methodology and our articles are not intended to be financial advice. It does not constitute a recommendation to buy or sell any stock, and does not take account of your objectives, or your financial situation. We aim to bring you long-term focused analysis driven by fundamental data. Note that our analysis may not factor in the latest price-sensitive company announcements or qualitative material. Simply Wall St has no position in any stocks mentioned.
Have feedback on this article? Concerned about the content? Get in touch with us directly. Alternatively, email editorial-team@simplywallst.com