

A Look at American Financial Group’s Valuation After Special Dividend and Earnings Reveal (AFG)
American Financial Group (AFG) declared a special $2.00 cash dividend and reported its third quarter results, highlighted by a rise in quarterly net income and earnings per share even as revenue edged lower year-over-year. These announcements are likely to draw fresh attention from investors.
See our latest analysis for American Financial Group.
After a steady climb through the past few months, American Financial Group’s 1-month share price return came in at 8.6%, helping lift the stock to $142.44. Momentum has picked up pace since late summer, reflecting management’s willingness to reward shareholders, along with buybacks and special dividends. Over the longer run, total shareholder return has been robust as well, up 7.7% over the past year and a remarkable 166% across five years. This perspective puts recent volatility in a much larger context.
If you’re interested in seeing what else stands out for strong momentum and insider confidence, this is a great time to broaden your search and discover fast growing stocks with high insider ownership
Given the stock’s strong multi-year returns and recent management actions, investors may wonder if American Financial Group shares are pricing in all future growth or if there is still a compelling buying opportunity ahead.
Most Popular Narrative: 3.7% Overvalued
Compared to its recent closing price of $142.44, the narrative places American Financial Group’s fair value at $137.40, which is slightly below the current market price. With market enthusiasm running high after the latest dividend news, this valuation draws a subtle line between momentum and expectations.
The ongoing accumulation of wealth among U.S. households is expected to drive greater demand for insurance and annuity products, positioning AFG for continued premium growth and positive impacts on revenue. Advancements in digital transformation and enhanced use of data analytics are supporting more disciplined underwriting and risk management at AFG, which should help improve net margins and operational profitability over the long term.
Want to know what underpins this valuation? Two powerful drivers—long-term earnings expansion and sharply improved profit margins—are at the core of this story. But the secret to why analysts see limited upside might surprise you. Dig deeper to uncover the exact mix of financial forecasts and margin assumptions that shape this outlook.
Result: Fair Value of $137.40 (OVERVALUED)
Have a read of the narrative in full and understand what's behind the forecasts.
However, persistent catastrophe losses and volatile returns on alternative investments could quickly shift AFG’s outlook if market conditions worsen.
Find out about the key risks to this American Financial Group narrative.
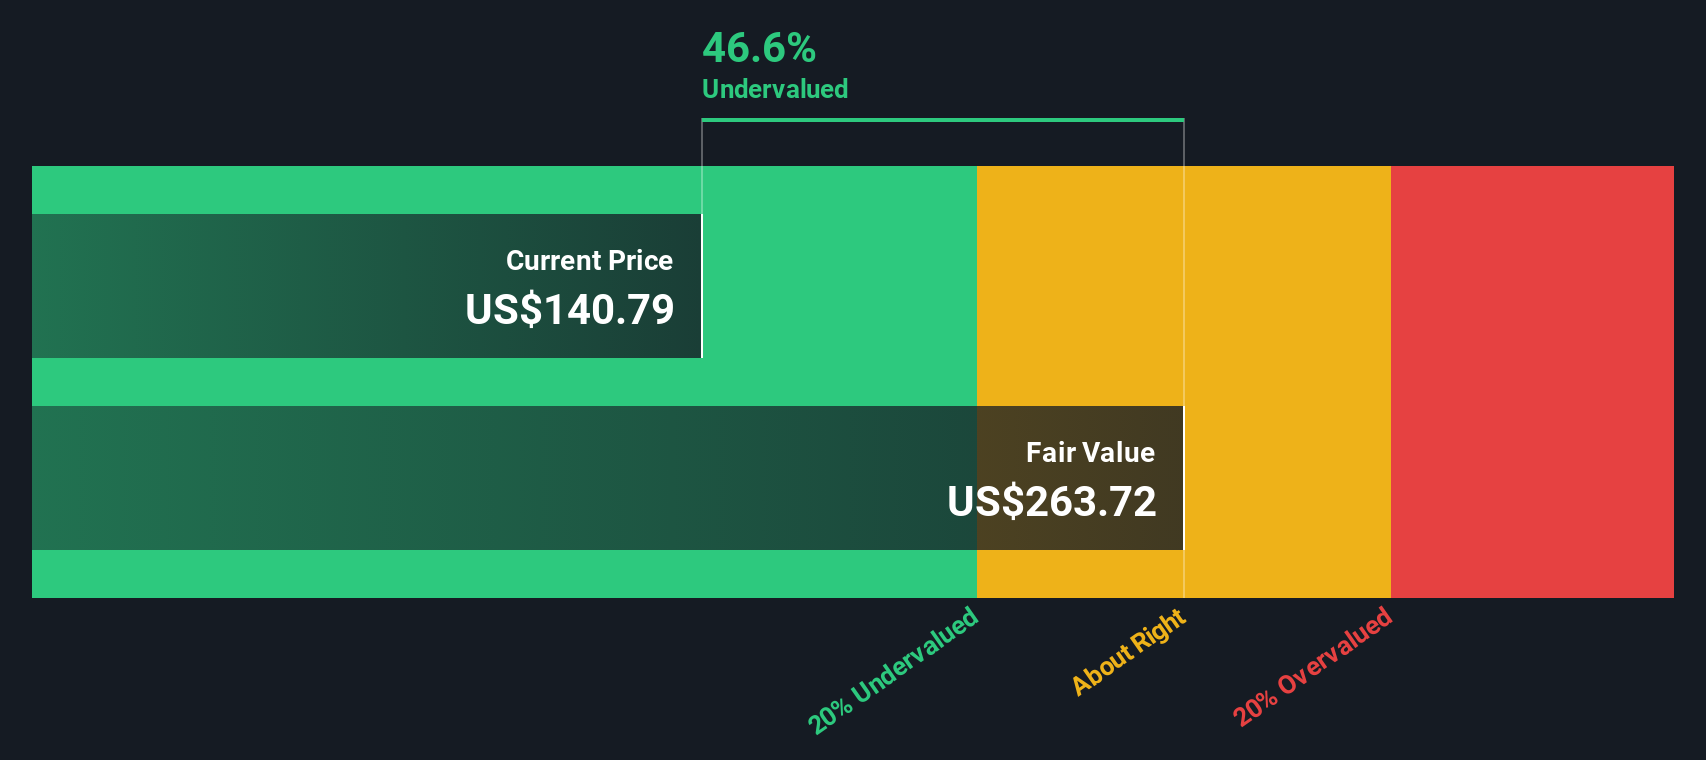
Another View: Discounted Cash Flow Suggests Opportunity
While the consensus analyst target points to shares being slightly overvalued, our DCF model tells a different story. It estimates American Financial Group’s fair value at $275.08 per share, which is almost double the current price. Why is there such a wide divide in valuation? Could the market be missing something fundamental?
Look into how the SWS DCF model arrives at its fair value.
Simply Wall St performs a discounted cash flow (DCF) on every stock in the world every day (check out American Financial Group for example). We show the entire calculation in full. You can track the result in your watchlist or portfolio and be alerted when this changes, or use our stock screener to discover 886 undervalued stocks based on their cash flows. If you save a screener we even alert you when new companies match - so you never miss a potential opportunity.
Build Your Own American Financial Group Narrative
If you want to put your own spin on the story or dive deeper into the numbers, you can quickly craft your personal analysis in just a few minutes. Do it your way
A great starting point for your American Financial Group research is our analysis highlighting 2 key rewards and 2 important warning signs that could impact your investment decision.
Looking for more investment ideas?
You could be overlooking your next big opportunity. The right tools can give you a serious edge, so don’t let a great pick pass you by.
- Maximize income potential and tap into stability by checking out these 16 dividend stocks with yields > 3% with strong yields poised to reward shareholders.
- Unlock high-growth potential and capitalize on market buzz with these 25 AI penny stocks built for breakthroughs in artificial intelligence innovation and disruption.
- Zero in on undervalued gems that the crowd might be missing with these 886 undervalued stocks based on cash flows based on proven cash flow fundamentals.
This article by Simply Wall St is general in nature. We provide commentary based on historical data and analyst forecasts only using an unbiased methodology and our articles are not intended to be financial advice. It does not constitute a recommendation to buy or sell any stock, and does not take account of your objectives, or your financial situation. We aim to bring you long-term focused analysis driven by fundamental data. Note that our analysis may not factor in the latest price-sensitive company announcements or qualitative material. Simply Wall St has no position in any stocks mentioned.
Have feedback on this article? Concerned about the content? Get in touch with us directly. Alternatively, email editorial-team@simplywallst.com