

A Look at St. Joe’s (JOE) Valuation Following Strong Q3 Earnings and Investor Optimism
St. Joe (JOE) shares climbed to a new 52-week high of $61.01 after the company announced third-quarter earnings per share above forecasts. Investors appear encouraged by solid results and ongoing strategic efforts.
See our latest analysis for St. Joe.
St. Joe's recent surge to a 52-week high caps off an impressive year for the stock, with a 36% year-to-date share price return and a standout 20.5% total shareholder return over the past twelve months. Momentum has been building, supported by both upbeat financials and optimism around the company's ongoing development projects.
If you’re on the lookout for more stocks making waves, now is a great time to broaden your search and discover fast growing stocks with high insider ownership
With St. Joe trading near record levels and strong momentum supporting its performance, the key question now is whether the current valuation presents an attractive entry point or if the market has already factored in its future growth prospects.
Price-to-Earnings of 33.5x: Is it justified?
St. Joe is trading at a price-to-earnings (P/E) ratio of 33.5x, which is notably below the average of 44.1x for its peer group. This positions the stock as good value relative to its immediate industry competitors, given the last close price of $60.75.
The price-to-earnings ratio reflects how much investors are willing to pay today for each dollar of current earnings. For a diversified real estate development and management company like St. Joe, this multiple can often speak to expectations around profit sustainability and future growth prospects.
Despite the shares trading at a premium to the broader real estate industry (P/E of 30x), St. Joe’s current multiple may be justified by its recent rapid profit growth, which has outpaced its sector, and improving profit margins. Its current P/E lags peers, suggesting the market may not be fully pricing in its earnings momentum or operational improvements. There is no available fair ratio for comparison. If the market gravitates closer to peer levels, further upside could exist for the stock.
See what the numbers say about this price — find out in our valuation breakdown.
Result: Price-to-Earnings of 33.5x (UNDERVALUED)
However, potential headwinds such as limited revenue transparency and uncertain growth rates could challenge the sustainability of St. Joe's current market momentum.
Find out about the key risks to this St. Joe narrative.
Another View: Discounted Cash Flow Perspective
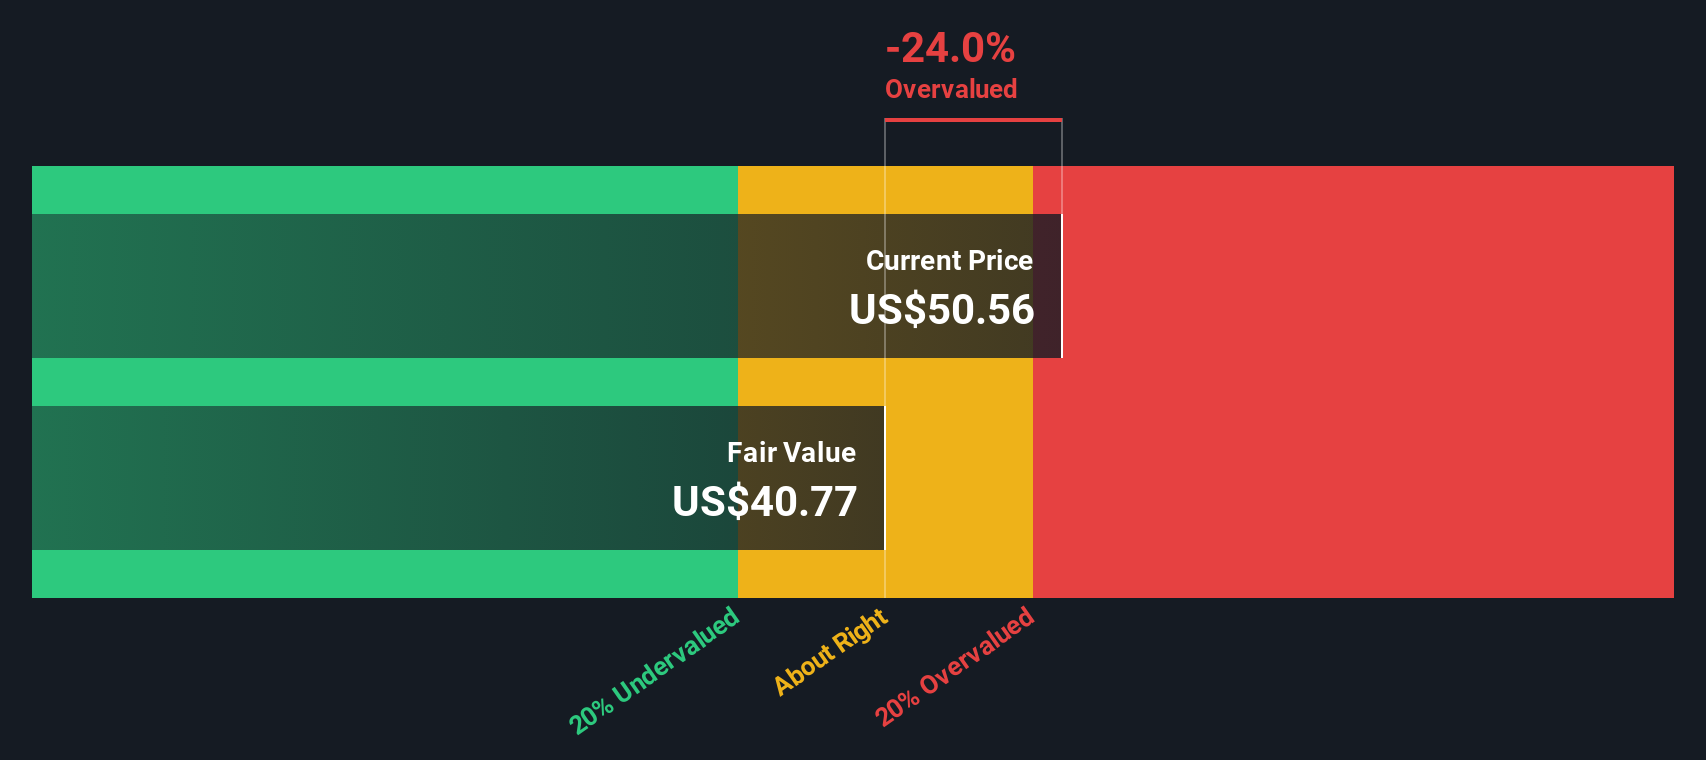
Taking another angle, our SWS DCF model estimates St. Joe's fair value at $79.85, which is about 24% above the current share price. This method suggests the stock could be undervalued and challenges the idea that its multiple already captures future growth potential. Could the market be overlooking longer-term fundamentals?
Look into how the SWS DCF model arrives at its fair value.
Simply Wall St performs a discounted cash flow (DCF) on every stock in the world every day (check out St. Joe for example). We show the entire calculation in full. You can track the result in your watchlist or portfolio and be alerted when this changes, or use our stock screener to discover 928 undervalued stocks based on their cash flows. If you save a screener we even alert you when new companies match - so you never miss a potential opportunity.
Build Your Own St. Joe Narrative
If you’d rather dig into the data yourself and draw your own conclusions, it’s easy to build a personal narrative in just a few minutes. Do it your way
A great starting point for your St. Joe research is our analysis highlighting 2 key rewards and 1 important warning sign that could impact your investment decision.
Ready to Spot Your Next Big Opportunity?
There has never been a better moment to uncover fresh stock ideas that match your investment goals. The right screen could set you apart and help you discover new possibilities for your portfolio. Do not let standout opportunities slip by.
- Catch high-yield payouts when you assess these 15 dividend stocks with yields > 3%, offering top dividend returns above 3% and steady income potential.
- Zero in on market innovation now by reviewing these 25 AI penny stocks, which are transforming industries with artificial intelligence breakthroughs.
- Seize value by pinpointing these 928 undervalued stocks based on cash flows, which the market may be overlooking, revealing opportunities based on their strong cash flows.
This article by Simply Wall St is general in nature. We provide commentary based on historical data and analyst forecasts only using an unbiased methodology and our articles are not intended to be financial advice. It does not constitute a recommendation to buy or sell any stock, and does not take account of your objectives, or your financial situation. We aim to bring you long-term focused analysis driven by fundamental data. Note that our analysis may not factor in the latest price-sensitive company announcements or qualitative material. Simply Wall St has no position in any stocks mentioned.
Have feedback on this article? Concerned about the content? Get in touch with us directly. Alternatively, email editorial-team@simplywallst.com