

Does Cheniere Energy’s New Supply Agreement Signal a Market Opportunity in 2025?
- Curious whether Cheniere Energy might be a hidden gem or priced for perfection? You're not alone, as it is a hot topic among investors eyeing the energy sector right now.
- The stock has seen a 1.4% uptick in the last week, despite having dipped 5.5% year-to-date and returning 263.8% over the past five years. This has sparked fresh conversations around its momentum and risk profile.
- Much of this movement ties back to ongoing shifts in global LNG demand and recent headlines about Cheniere's expanded supply agreements with major international partners, which has kept the stock in the spotlight. These deals are fueling speculation about growth, as well as questions about how sustainable current valuations might be.
- Cheniere Energy boasts a strong value score of 6 out of 6, meaning it is considered undervalued in every key metric tracked. The way that score is calculated by different valuation models can help investors make sense of the numbers before drawing conclusions.
Find out why Cheniere Energy's -6.1% return over the last year is lagging behind its peers.
Approach 1: Cheniere Energy Discounted Cash Flow (DCF) Analysis
A Discounted Cash Flow (DCF) model estimates a company’s value by projecting its future cash flows and discounting them back to their value today. This method helps investors assess what a company is truly worth based on the cash it is expected to generate.
For Cheniere Energy, the DCF valuation draws from current Free Cash Flow (FCF) of $2.8 Billion, with analyst estimates and projections showing FCF steadily growing to $4.6 Billion by 2029 and even higher in the years that follow. Analysts supply projections for the next five years, and numbers beyond that point are extrapolated to reflect likely performance. The DCF calculated here uses a Two Stage Free Cash Flow to Equity approach to capture both near-term and longer-term trends.
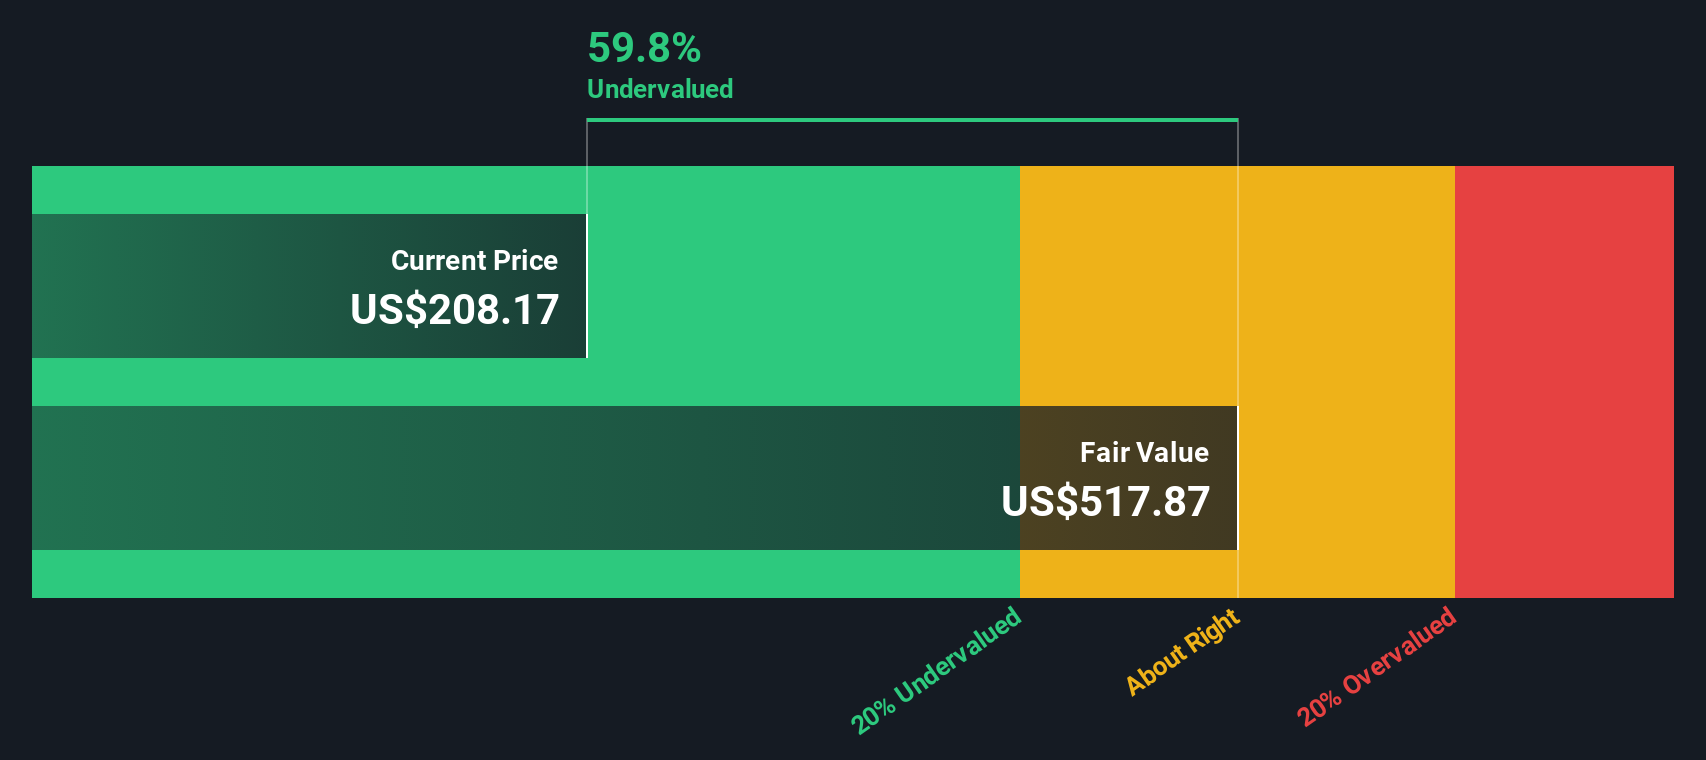
The model arrives at an estimated intrinsic value of $515.83 per share. Given that the current stock price trades at a 59.6% discount to this intrinsic value, the model signals that Cheniere Energy shares appear substantially undervalued by the market at this time.
Result: UNDERVALUED
Our Discounted Cash Flow (DCF) analysis suggests Cheniere Energy is undervalued by 59.6%. Track this in your watchlist or portfolio, or discover 919 more undervalued stocks based on cash flows.
Approach 2: Cheniere Energy Price vs Earnings
For consistently profitable companies like Cheniere Energy, the Price-to-Earnings (PE) ratio is a widely recognized method to gauge valuation. This metric helps investors understand how much they are paying for a dollar of earnings, making it especially meaningful when a company has stable and growing profits.
The “right” PE ratio for any given company can fluctuate based on expectations for future growth and the overall risk profile. Companies with higher expected growth or lower risk typically justify higher PE multiples, while slower-growing or riskier companies often warrant a discount.
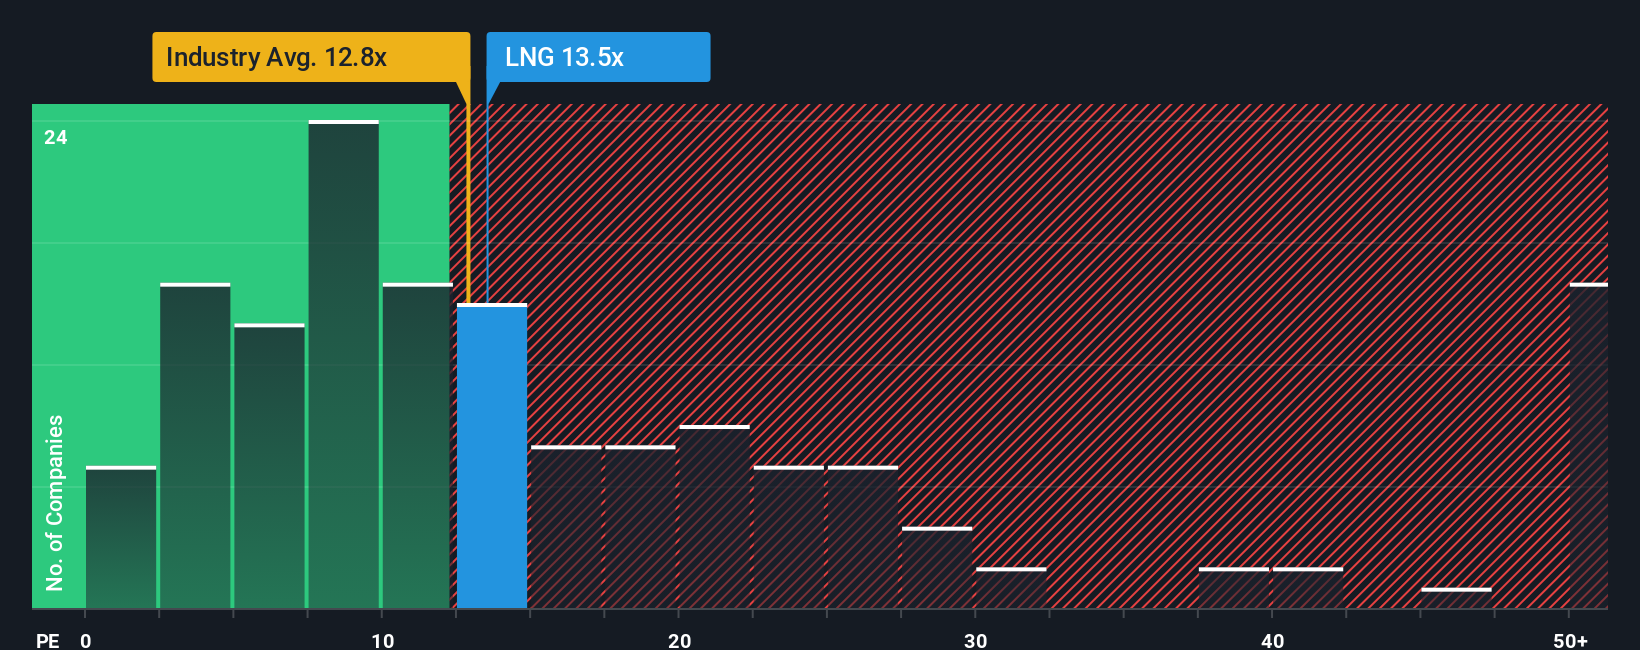
Currently, Cheniere Energy’s PE ratio stands at 11.23x. This is below the Oil and Gas industry average of 13.44x and well under the peer group average of 18.30x. On the surface, this suggests the stock could be trading at a discount compared to its sector and similar companies.
However, Simply Wall St’s proprietary “Fair Ratio” provides deeper context by factoring in Cheniere’s own growth prospects, profit margins, industry position, market capitalization, and risk profile. For Cheniere Energy, the Fair Ratio is 15.33x. This tailored benchmark offers a more specific view than simple industry or peer averages because it reflects the company’s unique attributes rather than lumping it into broad categories.
Comparing Cheniere’s current PE of 11.23x to its Fair Ratio of 15.33x, the stock appears undervalued according to this more nuanced analysis.
Result: UNDERVALUED
PE ratios tell one story, but what if the real opportunity lies elsewhere? Discover 1439 companies where insiders are betting big on explosive growth.
Upgrade Your Decision Making: Choose your Cheniere Energy Narrative
Earlier, we mentioned there is an even better way to understand valuation, so let's introduce you to Narratives. A Narrative is simply your story behind the numbers: it is your perspective on a company’s future turned into a clear, transparent set of forecasts, such as your own assumptions about Cheniere’s fair value, future revenue, profits, and margins.
With Narratives, you link your view of Cheniere’s business drivers and risks directly to a forecast and a resulting fair value, making your investment thesis tangible. Narratives are designed to be easy and accessible, available on Simply Wall St’s Community page used by millions of investors. They let you see exactly how your assumptions stack up against others and compare the company’s fair value from your Narrative to today’s market price, helping you decide your next steps.
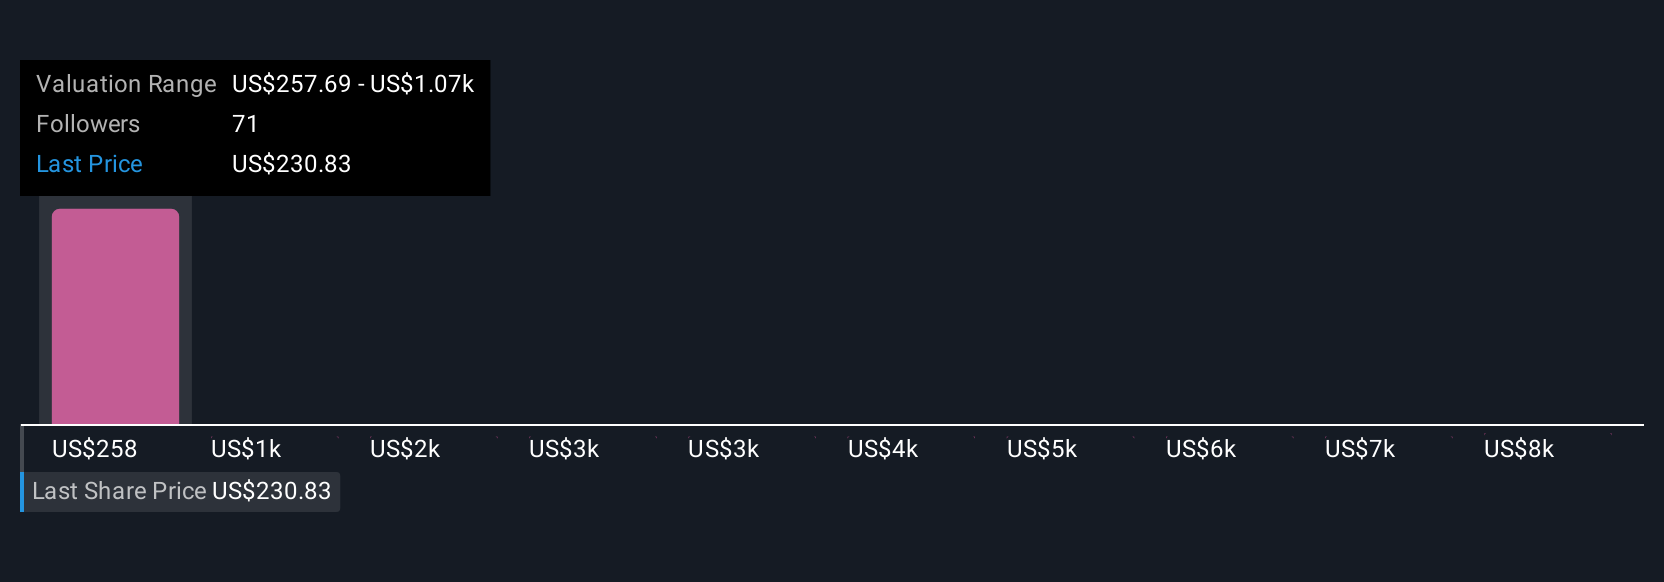
Narratives update automatically as new data, such as earnings releases or news, arrives so your story and fair value always stay relevant and up to date. For example, some Narratives for Cheniere Energy anticipate major growth from expanded LNG production and long-term contracts, forecasting a fair value as high as $295. Others warn of risks like global oversupply or regulatory headwinds, pegging fair value as low as $240. This shows how different investors can interpret the same company in distinctly different ways, each grounded in their own reasoning.
Do you think there's more to the story for Cheniere Energy? Head over to our Community to see what others are saying!
This article by Simply Wall St is general in nature. We provide commentary based on historical data and analyst forecasts only using an unbiased methodology and our articles are not intended to be financial advice. It does not constitute a recommendation to buy or sell any stock, and does not take account of your objectives, or your financial situation. We aim to bring you long-term focused analysis driven by fundamental data. Note that our analysis may not factor in the latest price-sensitive company announcements or qualitative material. Simply Wall St has no position in any stocks mentioned.
Have feedback on this article? Concerned about the content? Get in touch with us directly. Alternatively, email editorial-team@simplywallst.com