

Is It Too Late to Invest in Ensign Group After Its Strong Multi Year Rally?
- If you are wondering whether Ensign Group remains attractive after its recent run, or if you are arriving just as the value is fading, this breakdown aims to provide a clear, grounded view of what the stock may be worth.
- The share price has pulled back slightly in the short term, down 3.1% over the last week and 1.5% over the last month. It is still up 36.3% year to date and 24.6% over the past year, with gains of 97.9% over 3 years and 141.4% over 5 years that indicate a strong long-term trend.
- Recent headlines have focused on Ensign Group expanding its footprint through additional skilled nursing and senior living acquisitions, reinforcing its roll-up growth strategy and reflecting management confidence in the sector. At the same time, regulatory and reimbursement updates around post-acute and senior care have kept investors focused on both the potential upside from demographic tailwinds and the evolving risk backdrop.
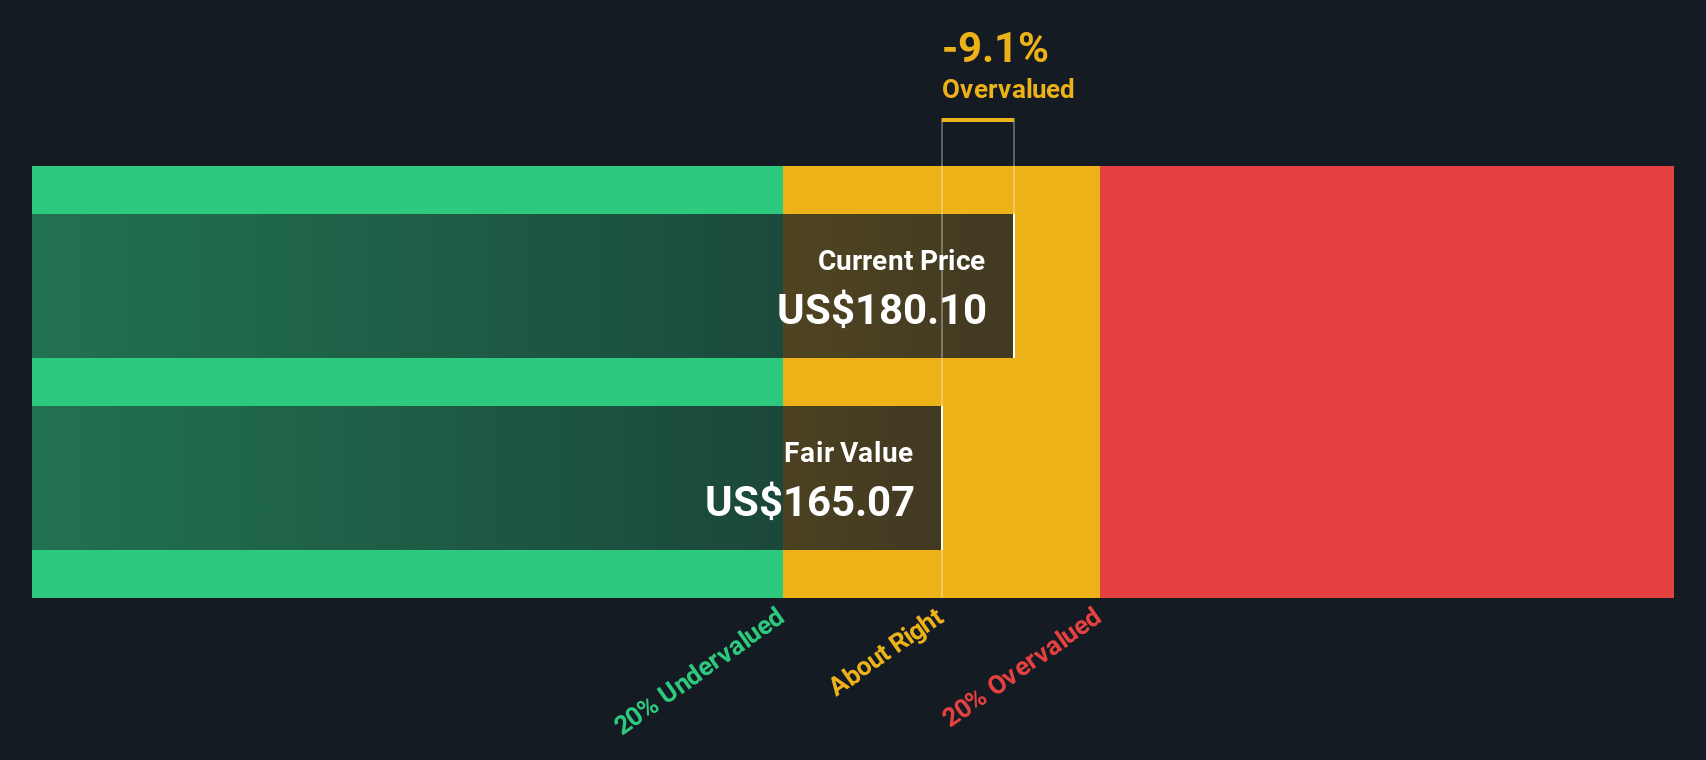
- Despite that performance, Ensign Group only scores 1 out of 6 on our undervaluation checks. Below, we walk through the main valuation approaches that drive that score, and then close with a more nuanced way to think about what the market might be missing.
Ensign Group scores just 1/6 on our valuation checks. See what other red flags we found in the full valuation breakdown.
Approach 1: Ensign Group Discounted Cash Flow (DCF) Analysis
A Discounted Cash Flow model estimates what a company is worth today by projecting its future cash flows and then discounting those amounts back to the present. For Ensign Group, the model uses its last twelve months Free Cash Flow of roughly $305.6 million as a starting point, with analysts providing near term estimates and Simply Wall St extrapolating the longer term path.
Under the 2 Stage Free Cash Flow to Equity approach, Ensign Group's Free Cash Flow is projected to grow steadily over the next decade, reaching around $601.3 million by 2035, based on gradually moderating growth rates. All cash flows are modeled and discounted in $ to reflect their value in today's terms.
Putting these projections together, the DCF model estimates an intrinsic value of about $207.18 per share. Compared to the current market price, this implies the stock is trading at roughly a 12.6% discount, which indicates that the projected cash flow growth may not be fully reflected in the current share price.
Result: UNDERVALUED
Our Discounted Cash Flow (DCF) analysis suggests Ensign Group is undervalued by 12.6%. Track this in your watchlist or portfolio, or discover 927 more undervalued stocks based on cash flows.
Approach 2: Ensign Group Price vs Earnings
For profitable, steadily growing companies like Ensign Group, the Price to Earnings (PE) ratio is a useful shorthand for how much investors are willing to pay for each dollar of current earnings. A higher PE can be justified when the market expects faster, more reliable earnings growth, while weaker growth prospects or higher risk should normally translate into a lower, more conservative PE multiple.
Ensign Group currently trades on a PE of about 31.7x. This is a premium to both the broader Healthcare industry average of roughly 22.1x and the peer group average of around 18.8x. Simply Wall St goes a step further by estimating a company specific Fair Ratio, which for Ensign Group is 25.9x. This proprietary measure adjusts for the company’s earnings growth profile, profitability, industry, market cap and risk characteristics, making it more tailored than a simple comparison with sector or peer averages.
Comparing Ensign Group’s actual PE of 31.7x with the Fair Ratio of 25.9x suggests the market is paying noticeably more than our fundamentals based estimate of a reasonable multiple. This indicates the shares look somewhat expensive on this measure.
Result: OVERVALUED

PE ratios tell one story, but what if the real opportunity lies elsewhere? Discover 1440 companies where insiders are betting big on explosive growth.
Upgrade Your Decision Making: Choose your Ensign Group Narrative
Earlier we mentioned that there is an even better way to understand valuation, so let us introduce you to Narratives, a simple way to connect your view of Ensign Group’s story with the numbers behind it. A Narrative is your own investing storyline, where you spell out what you believe about the company’s future revenue growth, profit margins and risk, and then translate that into a financial forecast and a fair value estimate. On Simply Wall St, Narratives are easy to create and explore within the Community page, where millions of investors share how they see a company and what they think it is worth. Narratives help you make decisions by constantly comparing your Fair Value to the live market price, and they automatically update when new information such as earnings reports, regulatory changes or acquisition news comes in. For Ensign Group, one investor might build a Narrative that supports a higher fair value based on acquisition driven growth, while another might set a much lower value assuming slower margins and greater regulatory risk.
Do you think there's more to the story for Ensign Group? Head over to our Community to see what others are saying!
This article by Simply Wall St is general in nature. We provide commentary based on historical data and analyst forecasts only using an unbiased methodology and our articles are not intended to be financial advice. It does not constitute a recommendation to buy or sell any stock, and does not take account of your objectives, or your financial situation. We aim to bring you long-term focused analysis driven by fundamental data. Note that our analysis may not factor in the latest price-sensitive company announcements or qualitative material. Simply Wall St has no position in any stocks mentioned.
Have feedback on this article? Concerned about the content? Get in touch with us directly. Alternatively, email editorial-team@simplywallst.com