

Weighing MillerKnoll’s Valuation After Herman Miller and Knoll Integration Progress
- Many investors are wondering whether MillerKnoll at around $15.70 is a beaten down value opportunity or a stock to avoid. That is exactly what this article will unpack.
- Despite being up about 3.0% over the last month, the share price is still down roughly 29.9% year to date and 36.5% over the past year. This suggests that the market remains cautious about its outlook.
- Recent headlines have focused on MillerKnoll's ongoing integration of its Herman Miller and Knoll brands, along with strategic moves such as portfolio streamlining and investments in higher margin, design led products. At the same time, investors are watching how the company navigates a softer commercial real estate environment and evolving demand for office and home workspace furniture.
- On our valuation checks, MillerKnoll scores a solid 5/6, suggesting it screens as undervalued on most metrics. Next, we will walk through the different valuation approaches behind that number before wrapping up with a more holistic way to think about what the stock may be worth.
Find out why MillerKnoll's -36.5% return over the last year is lagging behind its peers.
Approach 1: MillerKnoll Discounted Cash Flow (DCF) Analysis
A Discounted Cash Flow model estimates what a business is worth by projecting the cash it can generate in the future and then discounting those cash flows back to today using a required rate of return.
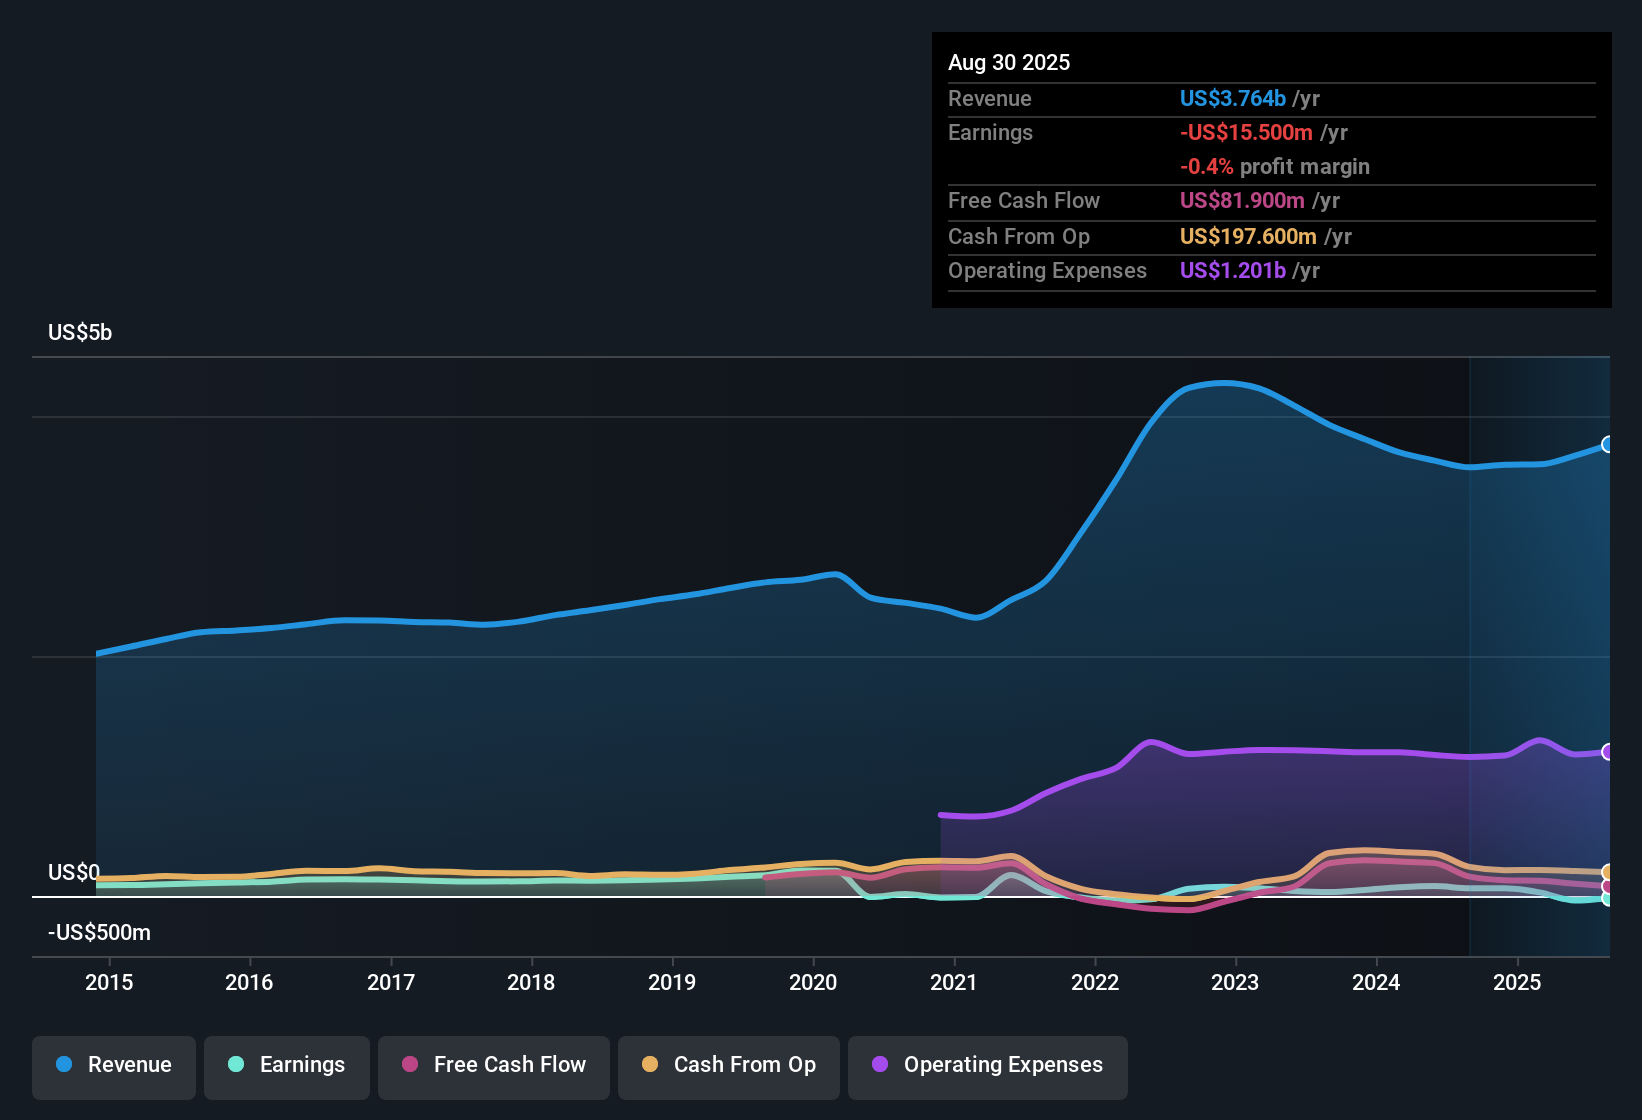
For MillerKnoll, the model starts with last twelve month Free Cash Flow of about $103 million and uses analyst forecasts out to 2027, then extrapolates further using Simply Wall St assumptions. Under this two stage Free Cash Flow to Equity approach, free cash flow is projected to grow to roughly $118 million by 2035, with growth moderating over time as the business matures.
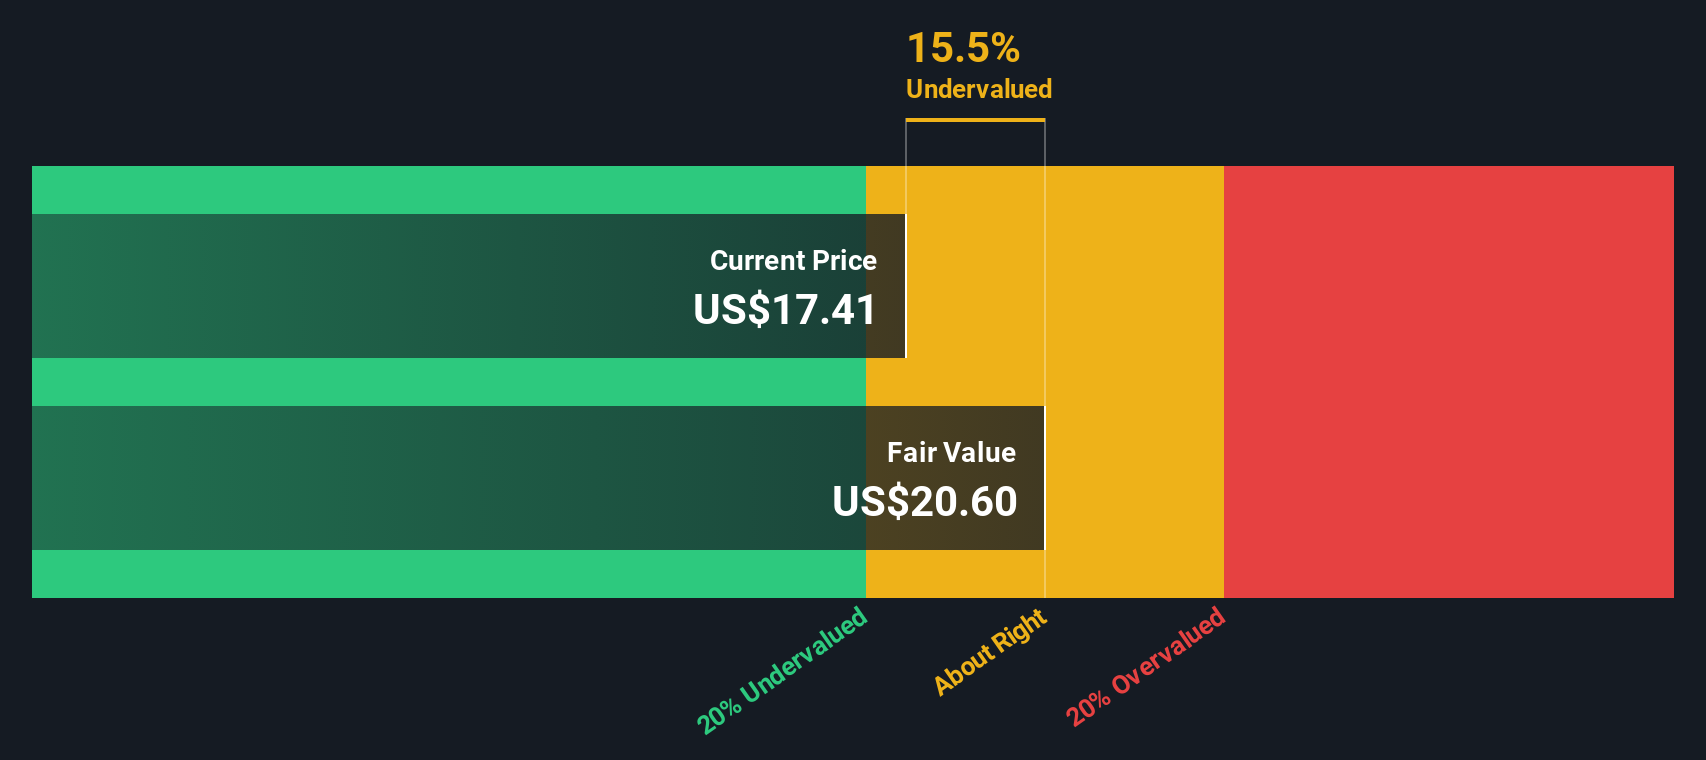
When all these future cash flows are discounted back to today, the DCF model arrives at an estimated intrinsic value of about $20.71 per share. Compared with the recent share price around $15.70, this indicates the stock is trading at an implied discount of roughly 24.2% on a cash flow basis, based on these model assumptions and projections.
Result: UNDERVALUED (model-based estimate)
Our Discounted Cash Flow (DCF) analysis suggests MillerKnoll is undervalued by 24.2%. Track this in your watchlist or portfolio, or discover 927 more undervalued stocks based on cash flows.
Approach 2: MillerKnoll Price vs Sales
For a business like MillerKnoll, where profits can swing with cycles and integration costs, the price to sales multiple is a useful way to value the company based on its revenue base rather than just current earnings. In general, higher growth and lower risk justify a higher normal multiple, while slower growth or elevated uncertainty call for a lower one.
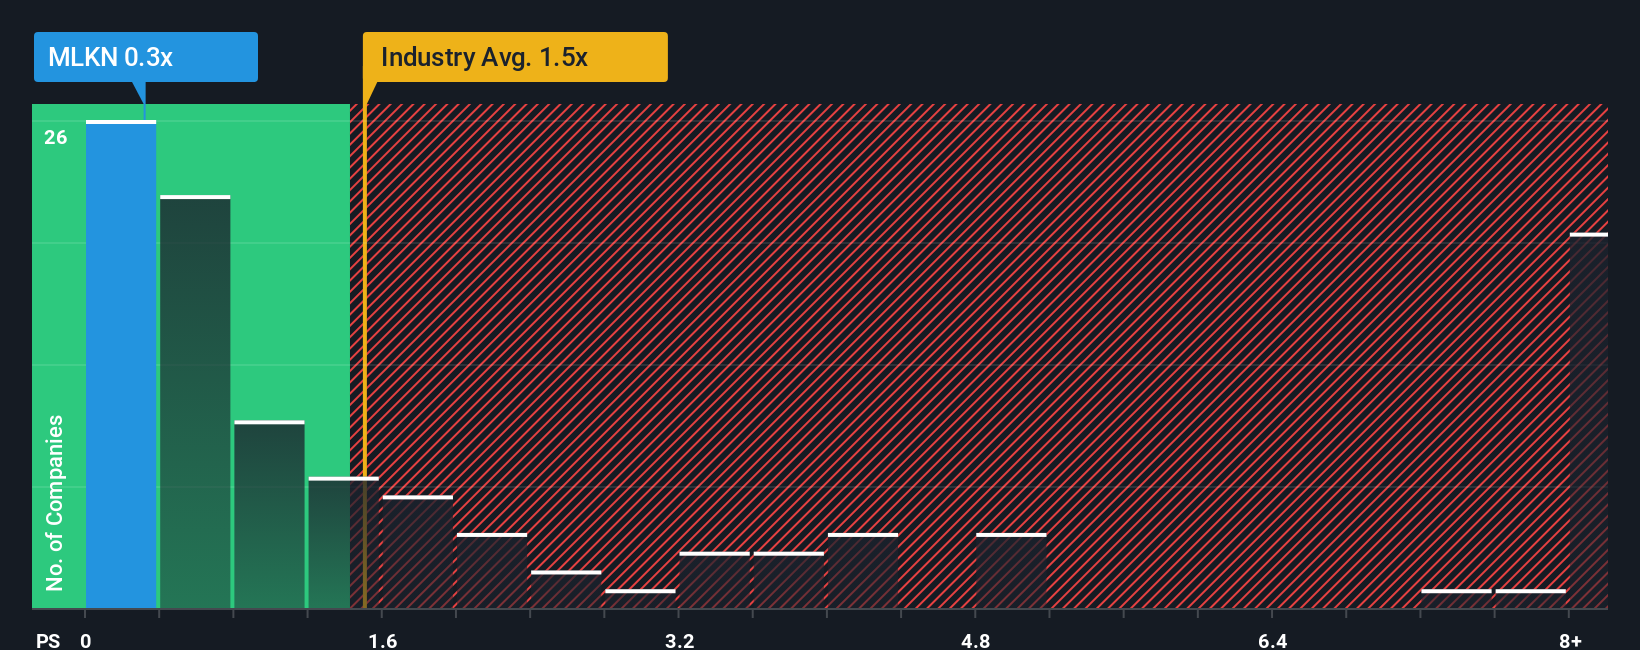
MillerKnoll currently trades on a price to sales ratio of about 0.29x, which is far below the Commercial Services industry average of roughly 1.07x and also well under the peer group average of around 0.82x. Simply Wall St goes a step further by estimating a Fair Ratio of 0.91x, a proprietary view of what MillerKnoll’s price to sales multiple should be once factors like expected growth, profitability, risk profile, industry positioning and market cap are taken into account. This tends to be more informative than a simple comparison with peers or the broad industry, which may have very different growth and risk characteristics.
With the current 0.29x multiple sitting well below the 0.91x Fair Ratio, the stock appears attractively priced on a sales basis.
Result: UNDERVALUED
PS ratios tell one story, but what if the real opportunity lies elsewhere? Discover 1439 companies where insiders are betting big on explosive growth.
Upgrade Your Decision Making: Choose your MillerKnoll Narrative
Earlier we mentioned that there is an even better way to understand valuation, so let's introduce you to Narratives. These are simple stories you create on Simply Wall St’s Community page that connect your view of MillerKnoll’s future revenue, earnings and margins to a financial forecast and a personal fair value. You can then compare that fair value to the current share price to see whether, based on your perspective, the stock looks like a buy or a sell today. Those Narratives update dynamically when new information such as earnings or news arrives.
For example, one investor might build a bullish Narrative that assumes continued restructuring success, stronger margins and a fair value closer to the higher community estimates around $35 per share. Another more cautious investor might focus on tariff risks, softer orders and pressure on retail profitability, leading them to a much lower fair value closer to the bottom end of community estimates. Both investors can transparently see how their story flows through the forecast to the valuation and adjust their decisions as the facts change.
Do you think there's more to the story for MillerKnoll? Head over to our Community to see what others are saying!
This article by Simply Wall St is general in nature. We provide commentary based on historical data and analyst forecasts only using an unbiased methodology and our articles are not intended to be financial advice. It does not constitute a recommendation to buy or sell any stock, and does not take account of your objectives, or your financial situation. We aim to bring you long-term focused analysis driven by fundamental data. Note that our analysis may not factor in the latest price-sensitive company announcements or qualitative material. Simply Wall St has no position in any stocks mentioned.
Have feedback on this article? Concerned about the content? Get in touch with us directly. Alternatively, email editorial-team@simplywallst.com