

Can Revolve Group’s Recent 24% Surge Justify Its Current Valuation in 2025?
- Wondering if Revolve Group at around $26.50 is a hidden opportunity or a value trap? You are not alone; this stock has been on a lot of investors' watchlists lately.
- In the very short term, the share price has bounced, up 7.2% over the last week and 24.4% over the last month, but those gains still sit against a tougher backdrop with the stock down 21.0% year to date and 25.7% over the last year.
- Recent headlines have highlighted shifting consumer spending patterns and competitive pressure in online fashion, which help explain why the market has stayed cautious despite those short term pops. Industry commentary around inventory management and customer acquisition costs has also kept sentiment mixed, even as some peers have started to recover.
- On our checks, Revolve Group currently scores 0 out of 6 for undervaluation, so we will walk through what the main valuation models say about that score, and then finish with a more holistic way to think about what the market might be getting wrong.
Revolve Group scores just 0/6 on our valuation checks. See what other red flags we found in the full valuation breakdown.
Approach 1: Revolve Group Discounted Cash Flow (DCF) Analysis
A Discounted Cash Flow, or DCF, model estimates what a business is worth by projecting the cash it can generate in the future and then discounting those cash flows back to today in $ terms.
For Revolve Group, the latest twelve month Free Cash Flow is about $66.6 million. Analysts provide detailed forecasts for the next few years, and from there Simply Wall St extrapolates a longer path using a 2 Stage Free Cash Flow to Equity model. On this basis, Revolve’s Free Cash Flow is projected to be around $68.7 million in 2035, implying only modest growth over the coming decade.
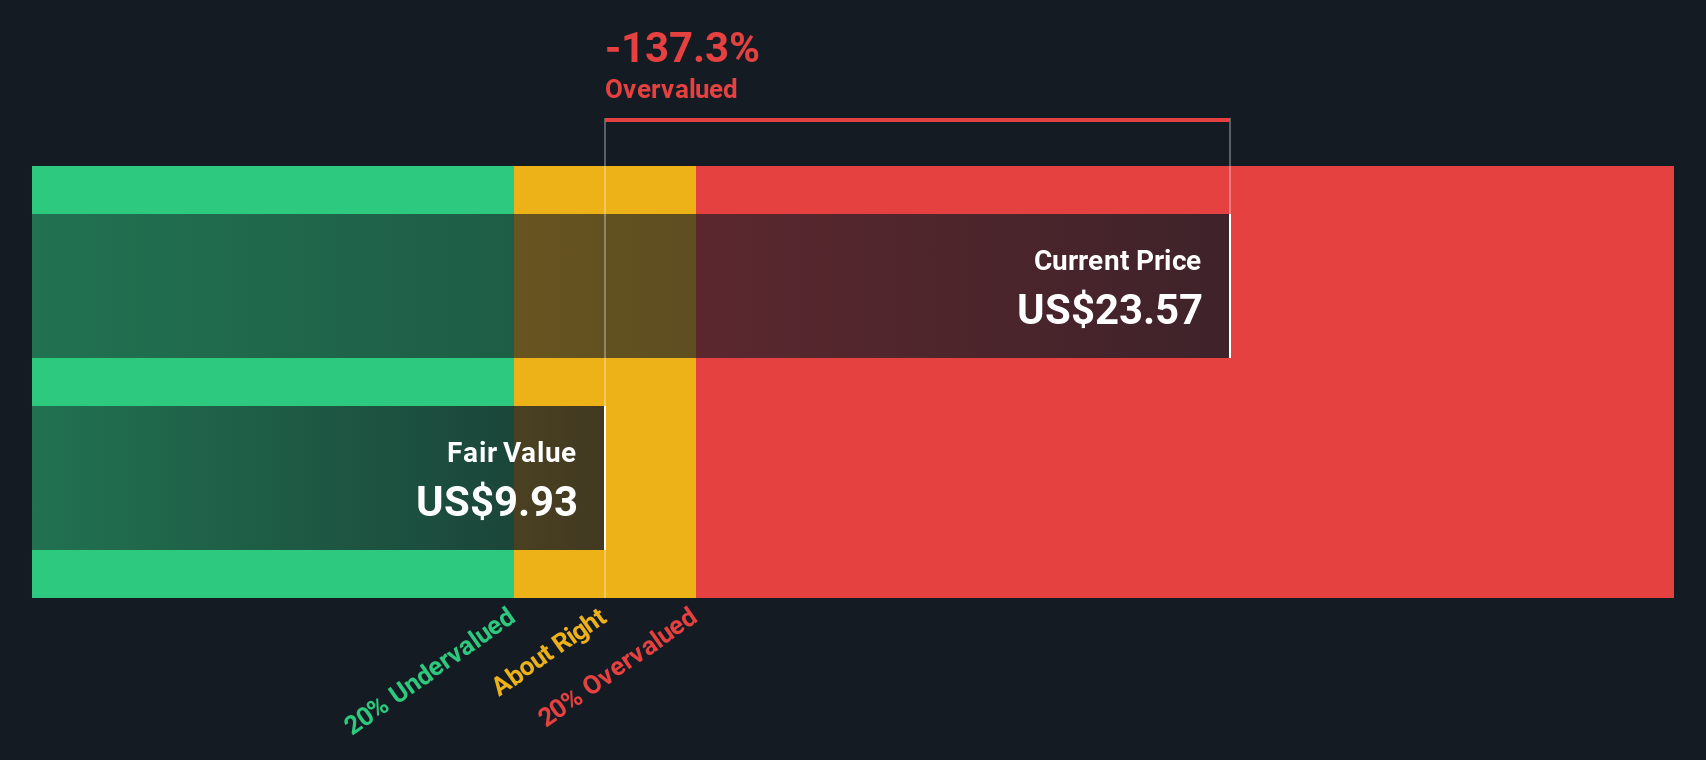
When all those future cash flows are discounted back to today, the model arrives at an estimate of intrinsic value of about $14.66 per share. Compared with a market price near $26.50, that suggests the stock is roughly 80.7% above this cash flow-based valuation.
Result: OVERVALUED
Our Discounted Cash Flow (DCF) analysis suggests Revolve Group may be overvalued by 80.7%. Discover 919 undervalued stocks or create your own screener to find better value opportunities.
Approach 2: Revolve Group Price vs Earnings
For a profitable business like Revolve Group, the price to earnings, or PE, ratio is a straightforward way to gauge how much investors are paying for each dollar of current earnings. In general, companies with stronger, more reliable growth prospects and lower perceived risk can justify a higher PE ratio, while slower growing or riskier businesses tend to trade on lower multiples.
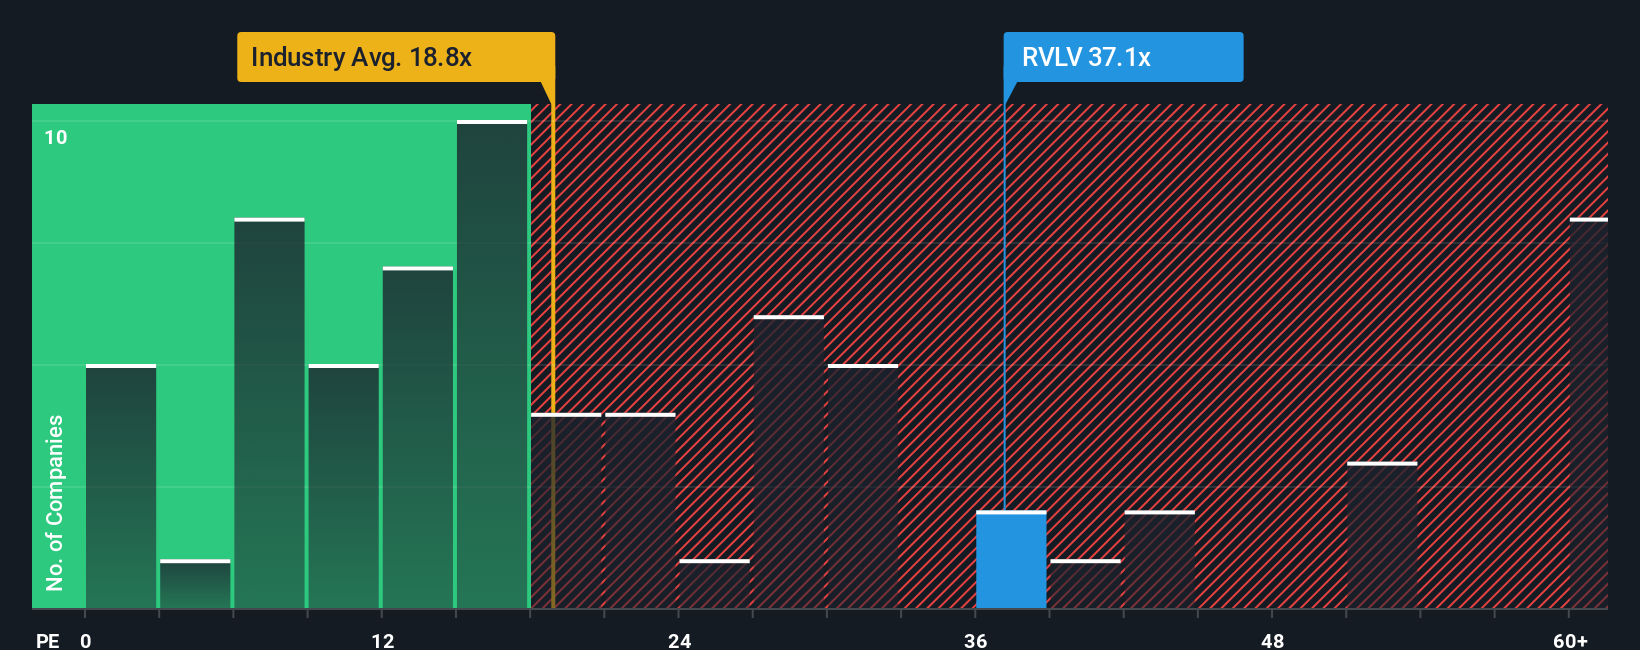
Revolve currently trades on a PE of about 34.1x, which is noticeably richer than both the Specialty Retail industry average of roughly 18.5x and the broader peer group at around 16.8x. Simply Wall St also calculates a Fair Ratio of 15.8x, which represents the PE you might expect given Revolve’s specific mix of earnings growth, profitability, size, industry positioning and risk profile. This Fair Ratio is more informative than a simple industry or peer comparison because it adjusts for the company’s own fundamentals rather than assuming all retailers deserve the same multiple.
Compared with that 15.8x Fair Ratio, Revolve’s 34.1x PE suggests the shares are pricing in far more optimism than its fundamentals justify.
Result: OVERVALUED
PE ratios tell one story, but what if the real opportunity lies elsewhere? Discover 1441 companies where insiders are betting big on explosive growth.
Upgrade Your Decision Making: Choose your Revolve Group Narrative
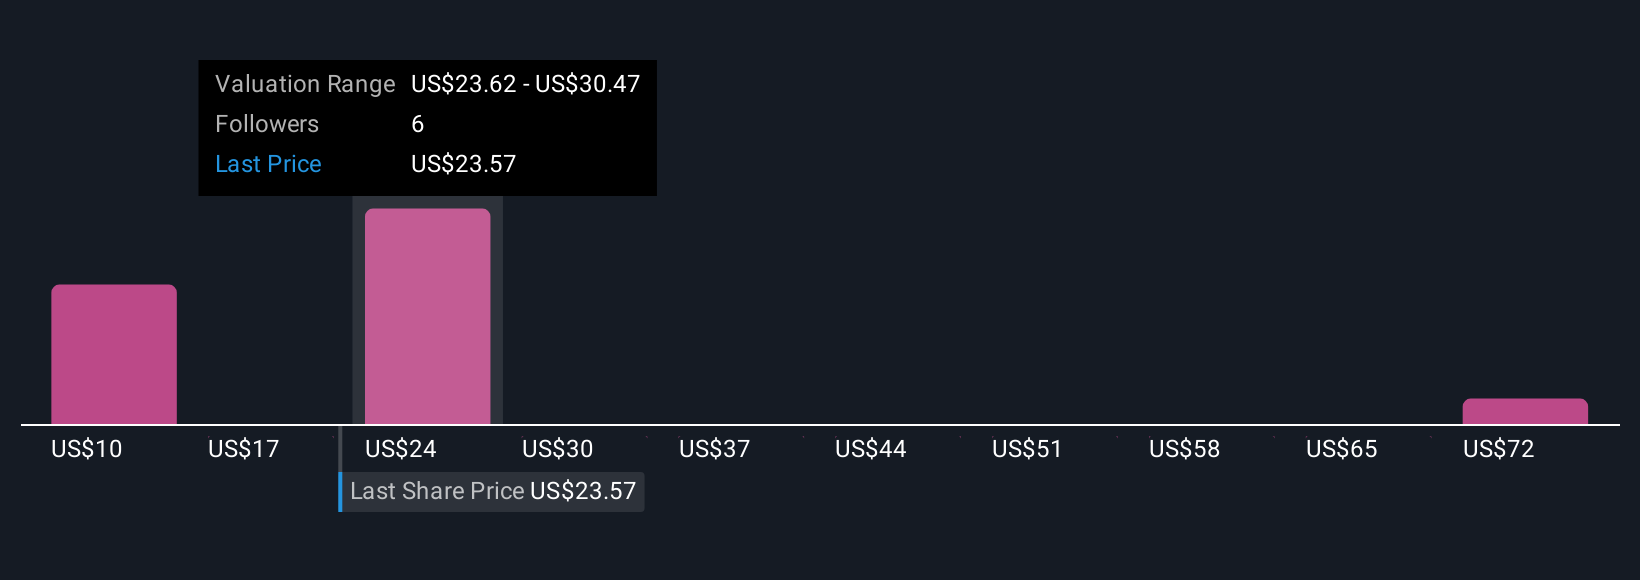
Earlier we mentioned that there is an even better way to understand valuation, so let us introduce you to Narratives, an approach that lets you connect your view of Revolve Group’s future with concrete numbers like revenue, earnings, margins and a fair value estimate. A Narrative is simply your story about the business, written in plain language, that is then translated into a financial forecast, which in turn produces a fair value you can compare to today’s share price. On Simply Wall St, millions of investors use Narratives on the Community page as an easy, guided tool to explore different scenarios, see how fair value changes, and decide whether the current price looks attractive or stretched. Narratives stay alive, updating dynamically as new earnings, news or guidance are released, so your fair value does not go stale. For example, some Revolve Narratives currently see upside from international expansion, AI driven personalization and margin improvement that support a fair value near the bullish analyst target around $30, while more cautious Narratives focus on tariff risks, influencer fatigue and inventory pressure, landing closer to the low target near $19.
Do you think there's more to the story for Revolve Group? Head over to our Community to see what others are saying!
This article by Simply Wall St is general in nature. We provide commentary based on historical data and analyst forecasts only using an unbiased methodology and our articles are not intended to be financial advice. It does not constitute a recommendation to buy or sell any stock, and does not take account of your objectives, or your financial situation. We aim to bring you long-term focused analysis driven by fundamental data. Note that our analysis may not factor in the latest price-sensitive company announcements or qualitative material. Simply Wall St has no position in any stocks mentioned.
Have feedback on this article? Concerned about the content? Get in touch with us directly. Alternatively, email editorial-team@simplywallst.com