

Is GameStop Stock Mispriced After Recent Share Price Volatility and Conflicting Value Signals?
How Has GameStop Been Performing Lately?
Before diving into what GameStop might actually be worth, it helps to pin down how the stock has been behaving and what has been driving sentiment lately.
- If you are wondering whether GameStop is still a misunderstood opportunity or already priced for perfection, taking a closer look at its recent performance and underlying value drivers is the logical next step.
- Over the last week the share price is up 6.1%, and over the past month it has gained 4.4%, but those short term gains still sit against a backdrop of a -25.1% return year to date and -18.9% over the last year.
- These swings have been shaped by ongoing debate about the sustainability of GameStop's turnaround efforts and the durability of its meme stock status, which continues to pull in speculative interest whenever trading volumes spike. At the same time, management's push to reposition the business toward a more digital and e commerce focused model has kept investors divided over how to value the company relative to traditional specialty retailers.
- On our framework GameStop currently scores 2 out of 6 on valuation checks, suggesting the market may not be offering a clear bargain. Next we will unpack what different valuation approaches say about the stock and then circle back to a more holistic way of thinking about its true worth.
GameStop scores just 2/6 on our valuation checks. See what other red flags we found in the full valuation breakdown.
Approach 1: GameStop Discounted Cash Flow (DCF) Analysis
A Discounted Cash Flow model projects the cash a company is expected to generate in the future and then discounts those cash flows back to today to estimate what the business is worth now.
For GameStop, the latest twelve month Free Cash Flow is about $474.5 million. Using a 2 Stage Free Cash Flow to Equity model, Simply Wall St projects that FCF could grow to around $1.38 billion by 2035, with faster growth in the near term that gradually tapers off over time. Analysts typically provide detailed forecasts only a few years ahead, so estimates beyond that are extrapolated from the earlier trends.
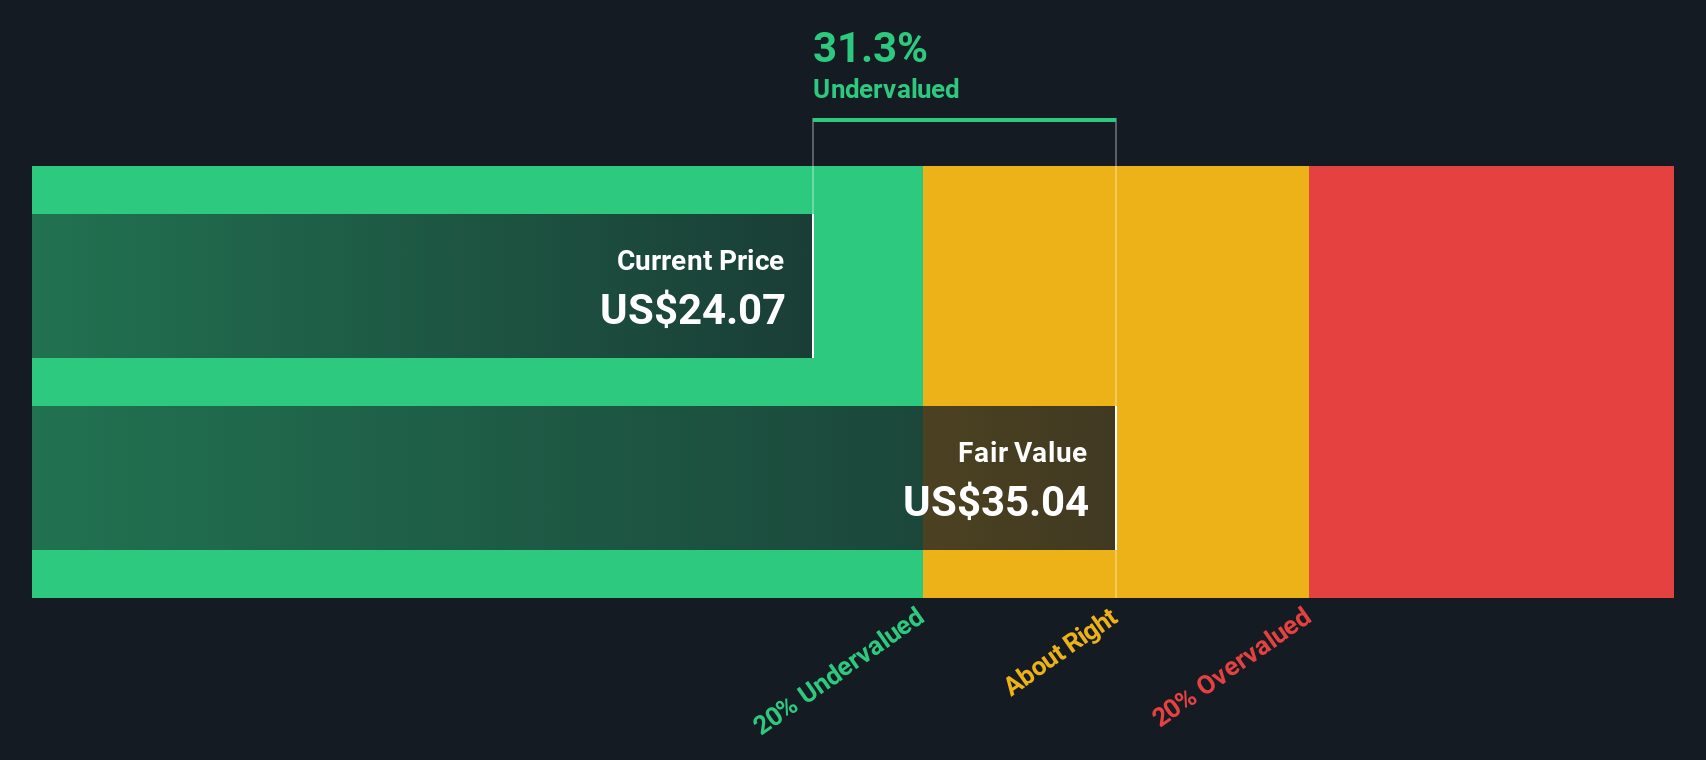
Discounting those projected cash flows back to today in dollars gives an intrinsic value estimate of roughly $34.72 per share. Compared with the current market price, this implies the shares are trading at about a 33.9% discount, on this view suggesting the stock is meaningfully undervalued relative to the DCF estimate.
Result: UNDERVALUED
Our Discounted Cash Flow (DCF) analysis suggests GameStop is undervalued by 33.9%. Track this in your watchlist or portfolio, or discover 912 more undervalued stocks based on cash flows.
Approach 2: GameStop Price vs Earnings
For a company that is generating positive earnings, the price to earnings (PE) ratio is a straightforward way to gauge how much investors are willing to pay today for each dollar of profit. Higher growth prospects and lower perceived risk usually justify a higher PE, while slower growth or greater uncertainty point to a lower, more conservative multiple.
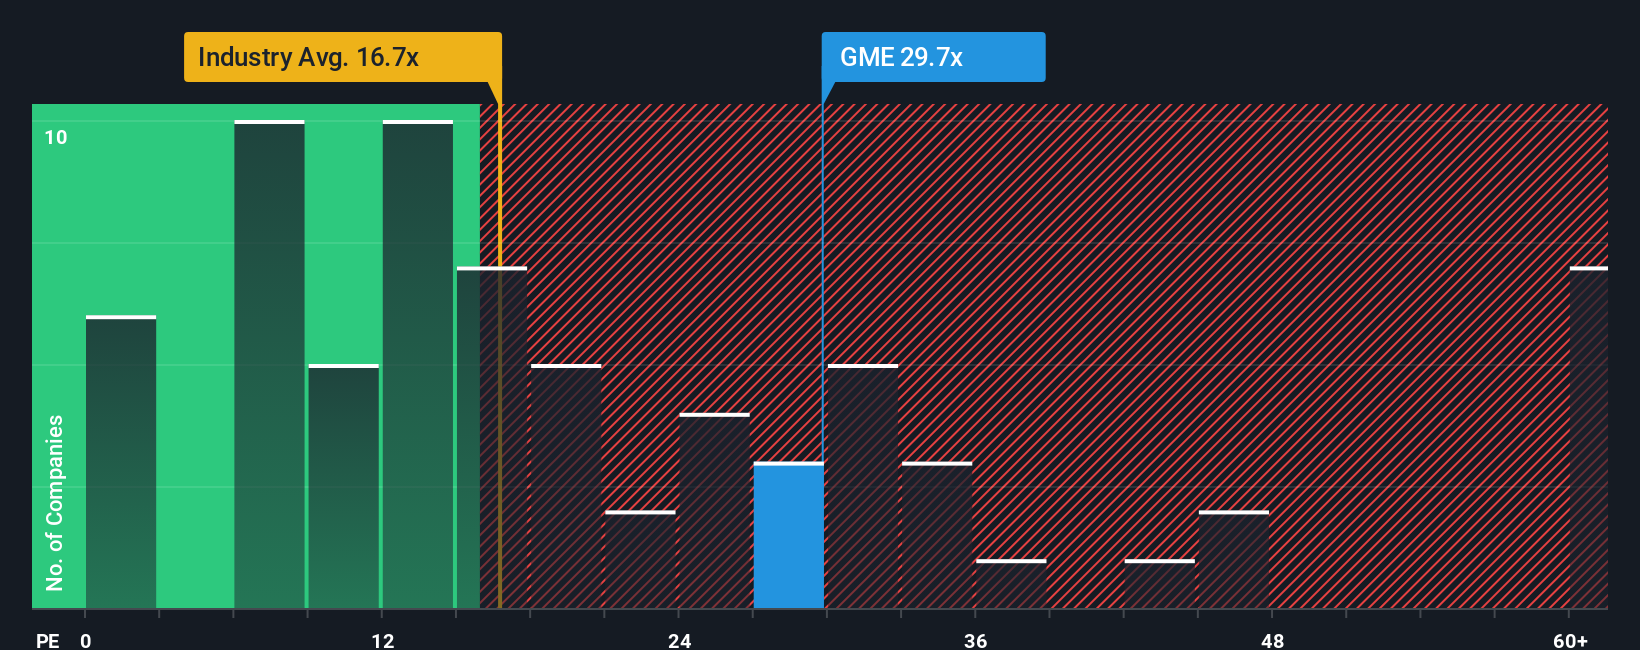
GameStop currently trades on a PE of about 28.4x. That sits well above both the broader Specialty Retail industry average of roughly 18.4x and the peer group average of around 19.2x, which signals that the market is already baking in elevated expectations for the business compared to typical retailers.
Simply Wall St also uses a proprietary Fair Ratio, an estimate of the PE multiple that would be appropriate for GameStop once you factor in its earnings growth outlook, risk profile, profit margins, industry positioning and market capitalization. This Fair Ratio offers a more tailored benchmark than simple peer or industry comparisons, because it explicitly adjusts for the company’s specific strengths and vulnerabilities instead of assuming all retailers deserve similar valuations. In GameStop’s case, the current PE sits materially above this Fair Ratio, indicating the shares look expensive on an earnings multiple basis.
Result: OVERVALUED
PE ratios tell one story, but what if the real opportunity lies elsewhere? Discover 1442 companies where insiders are betting big on explosive growth.
Upgrade Your Decision Making: Choose your GameStop Narrative
Earlier we mentioned that there is an even better way to understand valuation, so let us introduce you to Narratives, a simple way to attach your story about a company to the numbers behind it, including your view of fair value and your assumptions for future revenue, earnings and margins.
A Narrative on Simply Wall St links three things together in a structured way: what you believe is happening with the business, what that means for its financial forecast and, ultimately, what you think the stock is actually worth today.
These Narratives are easy to create and explore on the Community page of the Simply Wall St platform, used by millions of investors. They help you decide when to buy or sell by constantly comparing each Narrative’s Fair Value to the current share price.
Because Narratives are updated dynamically when new information arrives, such as earnings reports, news or insider trades, you can quickly see how fresh data shifts the story and the valuation without rebuilding your analysis from scratch.
For example, one GameStop Narrative on the Community page currently sees fair value near $120 per share while another places it closer to $11.91, reflecting very different convictions about its turnaround, Bitcoin exposure and long term profitability.
For GameStop however we'll make it really easy for you with previews of two leading GameStop Narratives:
Fair value: $120.00 per share
Implied undervaluation vs last close: 80.9%
Revenue growth assumption: 0%
- Highlights GameStop’s swing back to profitability, strong adjusted EPS, and a large cash balance with no long term debt as the foundation for a long runway of strategic options.
- Emphasizes the combination of Bitcoin holdings, direct registered shares, and a committed retail investor base as catalysts that could limit downside and fuel future short squeeze dynamics.
- Argues that Ryan Cohen’s leadership, cost cutting, and store rationalization are transforming GameStop into a lean, digitally focused, crypto exposed business that the market is still underestimating.
Fair value: $11.91 per share
Implied overvaluation vs last close: 92.7%
Revenue growth assumption: 0%
- Notes that while cost cutting and selected digital initiatives have helped restore profitability, GameStop’s core revenues remain under pressure from digital game distribution, weak consumer demand, and intense online competition.
- Points out that crypto initiatives and BNPL partnerships may add excitement but also introduce execution risk and do not yet provide clear, durable earnings power.
- Warns that the stock’s history as a meme favorite, with price spikes driven by speculative trading and influencer attention, makes it a volatile and potentially risky holding for long term investors focused on fundamentals.
Do you think there's more to the story for GameStop? Head over to our Community to see what others are saying!

This article by Simply Wall St is general in nature. We provide commentary based on historical data and analyst forecasts only using an unbiased methodology and our articles are not intended to be financial advice. It does not constitute a recommendation to buy or sell any stock, and does not take account of your objectives, or your financial situation. We aim to bring you long-term focused analysis driven by fundamental data. Note that our analysis may not factor in the latest price-sensitive company announcements or qualitative material. Simply Wall St has no position in any stocks mentioned.
Have feedback on this article? Concerned about the content? Get in touch with us directly. Alternatively, email editorial-team@simplywallst.com