

Is American Tower Now a Value Opportunity After Its Recent Share Price Slump?
- If you have been wondering whether American Tower is quietly turning into a value opportunity or a value trap, you are not alone. This article is going to unpack exactly that.
- Despite its scale and critical role in wireless infrastructure, the stock is down about 11.6% over the last year and roughly flat to slightly negative over the last few months. This has many investors asking if the current price finally compensates for the risks.
- Recent moves in interest rates and shifting expectations for future cuts have weighed on real estate investment trusts like American Tower, as higher yields elsewhere can make income focused stocks less attractive. At the same time, continued 5G rollout, carrier network upgrades and growing data usage have reinforced the long term demand story for its tower and data center assets.
- On our numbers, American Tower scores a 6/6 valuation check, which suggests it screens as undervalued across every metric we track. We will walk through what that actually means using different valuation approaches and then finish with a framework that can give an even clearer picture of what the stock is really worth.
Approach 1: American Tower Discounted Cash Flow (DCF) Analysis
A Discounted Cash Flow model projects American Tower’s future adjusted funds from operations, then discounts those cash flows back to today in $ terms to estimate what the business is worth right now.
On this basis, the company’s latest twelve month free cash flow is about $4.9 billion, and analysts expect it to keep rising as data usage and 5G related demand grow. By 2029, free cash flow is projected to reach roughly $6.4 billion, with further increases to about $8.2 billion by 2035, based on a blend of analyst estimates and Simply Wall St extrapolations.
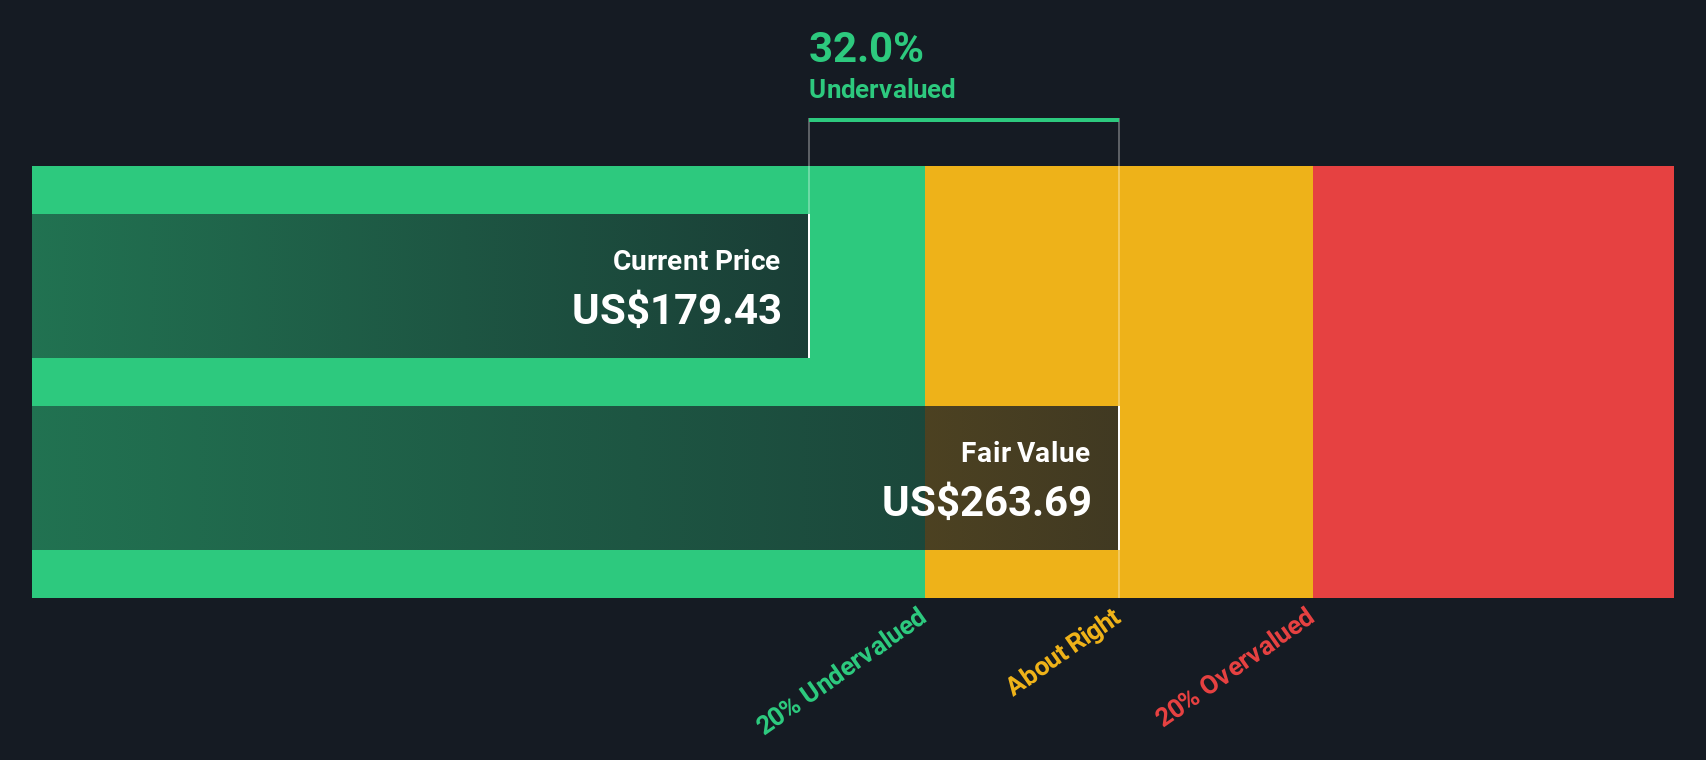
Aggregating and discounting these future cash flows using a 2 stage Free Cash Flow to Equity model gives an estimated intrinsic value of about $261.43 per share. That compares to a current market price that implies the stock is trading at a 31.6% discount, indicating that investors are taking on execution and interest rate risk in exchange for this pricing.
Result: UNDERVALUED
Our Discounted Cash Flow (DCF) analysis suggests American Tower is undervalued by 31.6%. Track this in your watchlist or portfolio, or discover 907 more undervalued stocks based on cash flows.
Approach 2: American Tower Price vs Earnings
For a profitable company like American Tower, the price to earnings ratio is a useful shorthand for how much investors are willing to pay today for each dollar of current earnings. It naturally bakes in expectations about future growth and the risks around delivering it, so faster growing or more resilient businesses typically deserve a higher, or premium, PE multiple.
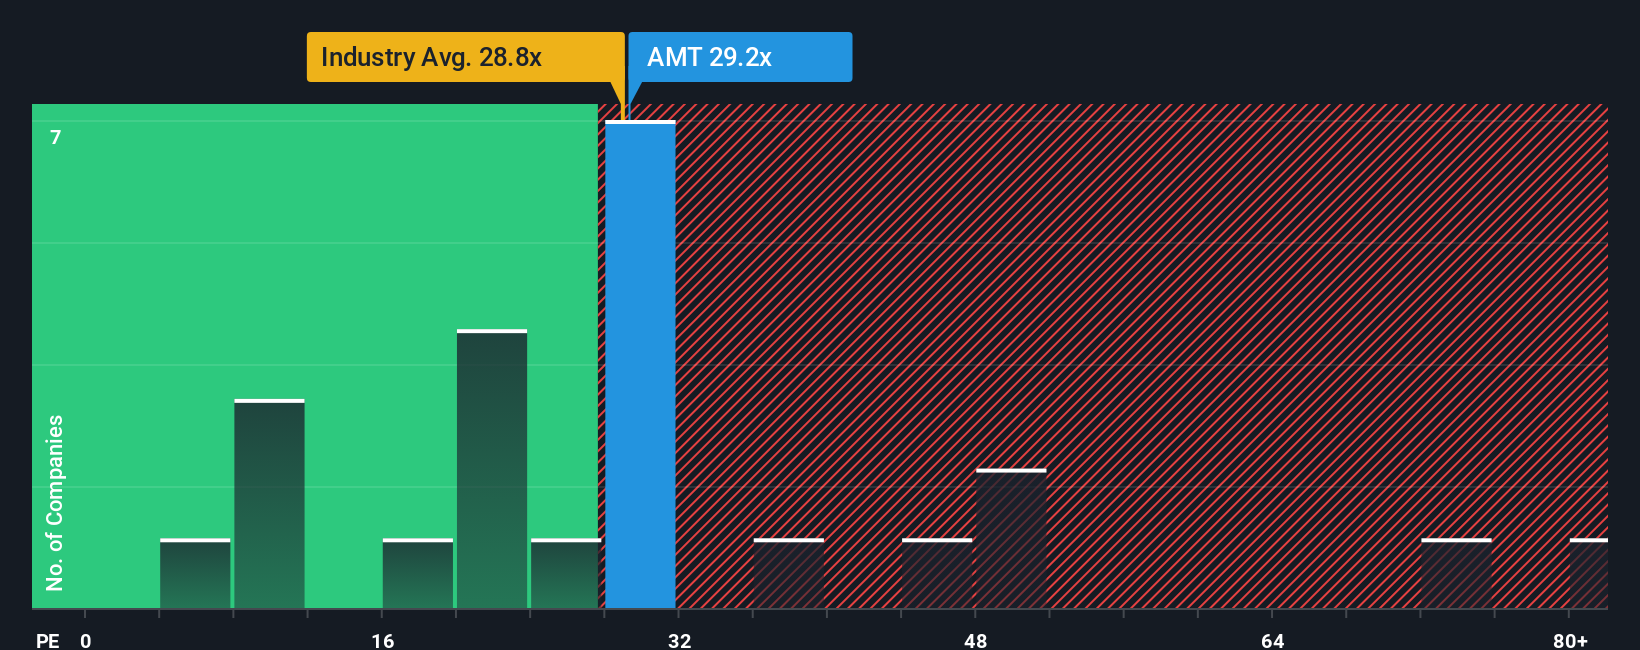
In practice, what counts as a normal or fair PE depends on how quickly earnings are expected to compound and how predictable those earnings are. Higher growth and lower perceived risk can justify a higher PE, while slower growth or elevated risk usually push a fair multiple lower. American Tower is currently trading at about 28.5x earnings, above the Specialized REITs industry average of roughly 16.8x, but at a discount to its large cap peers that trade around 39.9x.
Simply Wall St’s Fair Ratio framework refines this comparison by estimating the PE multiple the stock should trade on, given its specific earnings growth outlook, margins, industry, market cap and risk profile. For American Tower, that Fair Ratio is about 32.9x. According to this model, the stock deserves a premium to both the sector and the broader market. Since the current 28.5x multiple sits below this Fair Ratio, the shares screen as modestly undervalued on a PE basis.
Result: UNDERVALUED
PE ratios tell one story, but what if the real opportunity lies elsewhere? Discover 1443 companies where insiders are betting big on explosive growth.
Upgrade Your Decision Making: Choose your American Tower Narrative
Earlier we mentioned that there is an even better way to understand valuation, so let us introduce you to Narratives, a simple way to connect your view of a business with the numbers behind it. A Narrative is your story about a company, captured as assumptions about its future revenue, earnings, margins and risk, which then flow through to a clear financial forecast and Fair Value estimate. On Simply Wall St, Narratives are an easy, accessible tool on the Community page, used by millions of investors to turn their perspective into a structured valuation they can track over time. By comparing each Narrative’s Fair Value to the current market Price, investors can quickly see whether their story suggests they should buy, hold or sell. Narratives update dynamically as new information like earnings or major news comes in, so your valuation stays in sync with reality instead of becoming stale. For American Tower, one investor might build a Narrative with optimistic 5G driven growth and higher margins, while another bakes in slower tower demand and tighter profitability, leading to very different Fair Values and decisions.
Do you think there's more to the story for American Tower? Head over to our Community to see what others are saying!
This article by Simply Wall St is general in nature. We provide commentary based on historical data and analyst forecasts only using an unbiased methodology and our articles are not intended to be financial advice. It does not constitute a recommendation to buy or sell any stock, and does not take account of your objectives, or your financial situation. We aim to bring you long-term focused analysis driven by fundamental data. Note that our analysis may not factor in the latest price-sensitive company announcements or qualitative material. Simply Wall St has no position in any stocks mentioned.
Have feedback on this article? Concerned about the content? Get in touch with us directly. Alternatively, email editorial-team@simplywallst.com