

SAIC (SAIC) Q3 2026: Margin Expansion Reinforces Bullish Narrative Despite Revenue Pressure
Science Applications International (SAIC) opened Q3 2026 with Q2 revenue of about $1.8 billion and basic EPS of $2.72, setting the tone for another data heavy earnings season. The company has seen quarterly revenue move from $1.82 billion in Q2 2025 to $1.77 billion in Q2 2026, while EPS over that same span ranged from $1.59 to $2.72. This frames a period of shifting top line and per share results that investors will be watching closely. With trailing net profit margins now higher than a year ago, the latest print points to a business still working its revenue base harder to support profitability.
See our full analysis for Science Applications International.With the headline numbers on the table, the next step is to line them up against the prevailing narratives around SAIC and see which stories the latest margin trends actually support, and which ones start to look stretched.
See what the community is saying about Science Applications International
Margins Rise as Revenue Slips
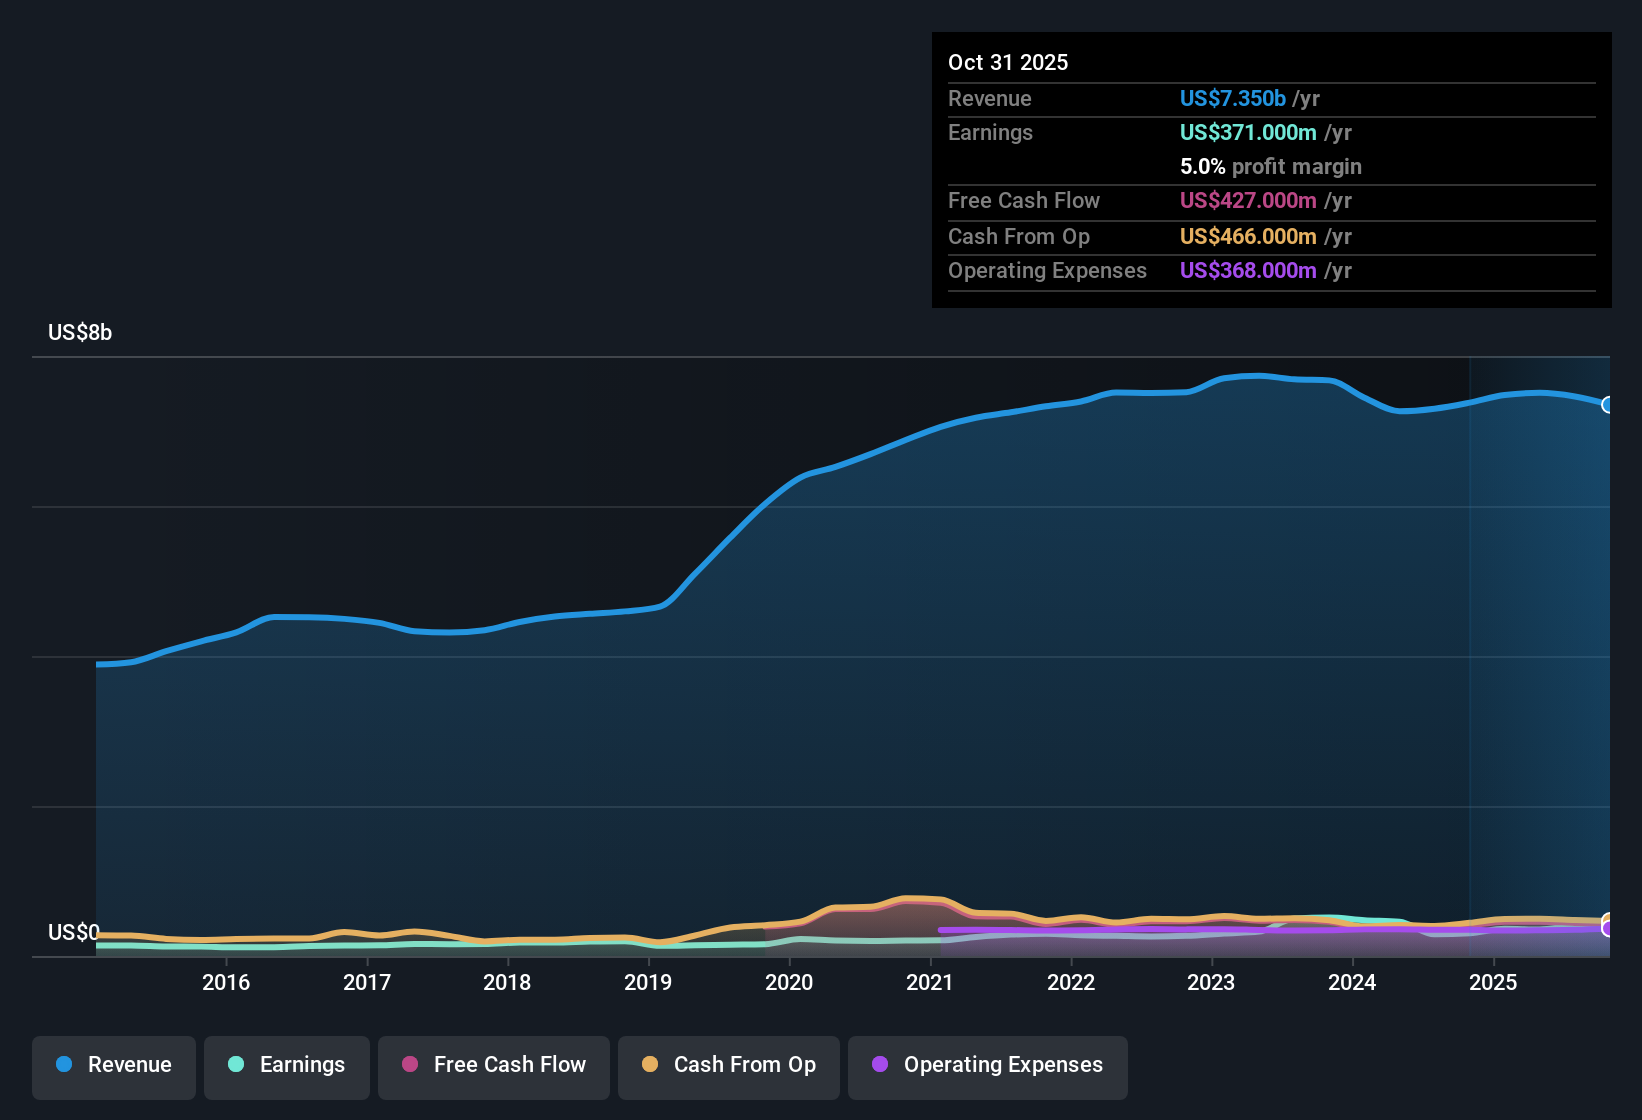
- Net income excluding extra items increased from $81 million in Q2 2025 to $127 million in Q2 2026 even though revenue dipped from $1.82 billion to $1.77 billion, pushing the trailing net profit margin to 5.3 percent versus 4.0 percent a year earlier.
- Bears highlight that government budget efforts to drive efficiency and spending controls could keep that $1.77 billion revenue line under pressure. However, the higher 5.3 percent margin shows SAIC has been using cost controls and automation to support profitability even as traditional, labor heavy IT work faces pricing and mix pressure.
Strong Earnings Growth vs Slower Outlook
- Trailing earnings grew 36.7 percent over the last year and five year earnings have compounded at 11.8 percent annually. Analysts, however, expect earnings to grow more slowly at about 4.87 percent per year from here, with profit margins modeled to ease from 5.3 percent to 4.5 percent by around 2028.
- Consensus narrative notes that ongoing investments in artificial intelligence and modernization should keep supporting cash flow and margins, but the forecast step down in earnings growth and margins highlights the bearish concern that slower government IT and defense budget growth could cap how much benefit SAIC ultimately gets from that strategy.
Discounted Valuation with Debt Overhang
- At a share price of $101.79, SAIC trades on about 11.7 times earnings, well below the US professional services industry at 24.8 times and peers at 23.3 times, and also below a DCF fair value of roughly $186.3, while offering a 1.45 percent dividend yield.
- Bulls argue this valuation gap looks appealing given the 36.7 percent trailing earnings growth and improving margins. The presence of a high debt load, however, keeps the bearish narrative alive that leverage could limit flexibility if growth stays near the 1.0 percent revenue pace analysts expect.
Next Steps
To see how these results tie into long-term growth, risks, and valuation, check out the full range of community narratives for Science Applications International on Simply Wall St. Add the company to your watchlist or portfolio so you'll be alerted when the story evolves.
See the numbers differently, or draw a different conclusion on SAIC’s outlook, then turn that view into your own narrative in minutes, Do it your way.
A great starting point for your Science Applications International research is our analysis highlighting 5 key rewards and 1 important warning sign that could impact your investment decision.
See What Else Is Out There
SAIC’s slower expected earnings growth, modest revenue trajectory, and high debt load suggest future returns could be more constrained and volatile than recent results imply.
If that leverage overhang makes you uneasy, use our solid balance sheet and fundamentals stocks screener (1939 results) today to quickly zero in on financially stronger companies built to handle shocks without sacrificing growth.
This article by Simply Wall St is general in nature. We provide commentary based on historical data and analyst forecasts only using an unbiased methodology and our articles are not intended to be financial advice. It does not constitute a recommendation to buy or sell any stock, and does not take account of your objectives, or your financial situation. We aim to bring you long-term focused analysis driven by fundamental data. Note that our analysis may not factor in the latest price-sensitive company announcements or qualitative material. Simply Wall St has no position in any stocks mentioned.
Have feedback on this article? Concerned about the content? Get in touch with us directly. Alternatively, email editorial-team@simplywallst.com