

Has Sanmina’s 113% 2025 Surge Stretched Its Valuation Too Far?
- If you have been wondering whether Sanmina is still a buy after its huge run, you are not alone. This is exactly the kind of stock where valuation really matters.
- The share price has climbed to around $160.76, with a 113.0% gain year to date and 103.2% over the last year, even though the last 30 days saw a modest pullback of 1.7% after a 3.3% rise in the past week.
- Much of this momentum has been tied to growing optimism around Sanmina’s role as a high reliability manufacturing partner in areas like communications infrastructure and advanced industrial hardware, where long term contracts can justify higher valuations. At the same time, investors are reassessing the risk profile as supply chain conditions normalize and the market places a premium on companies that can execute consistently across cycles.
- Despite those gains, Sanmina only scores a 2 out of 6 on our valuation checks. This suggests the market might be paying up on some metrics while still leaving potential on others. In the next sections we will walk through each valuation lens, then finish with a more intuitive way to tie all of them together.
Sanmina scores just 2/6 on our valuation checks. See what other red flags we found in the full valuation breakdown.
Approach 1: Sanmina Discounted Cash Flow (DCF) Analysis
A Discounted Cash Flow, or DCF, model estimates what a company is worth by projecting its future cash flows and then discounting them back to today, adjusting for risk and the time value of money.
Sanmina generated roughly $472.1 Million of Free Cash Flow over the last twelve months in $. Under the 2 Stage Free Cash Flow to Equity model, analyst forecasts and extrapolations from Simply Wall St see FCF dipping in the near term, with a negative $463.2 Million in 2026 before recovering to $236.3 Million by 2027 and moderating thereafter. By 2035, projected FCF is about $140.9 Million, indicating a relatively flat long term cash profile rather than rapid compound growth.
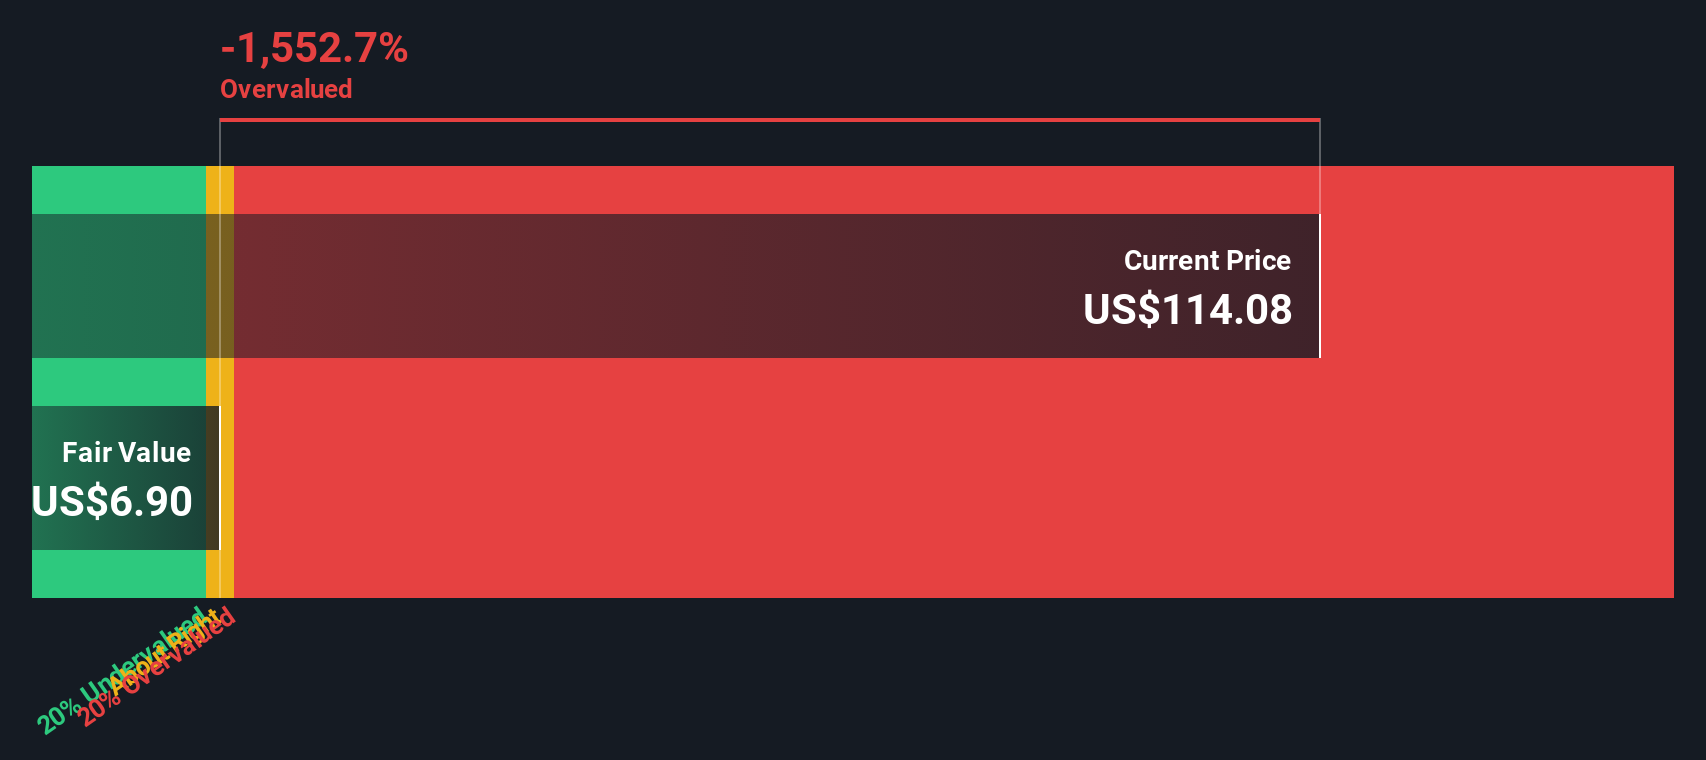
When these projected cash flows are discounted back, the model arrives at an intrinsic value of about $31.77 per share in $. Compared with the current share price around $160.76, the DCF suggests the stock is roughly 406.0% above this estimate of intrinsic value, a substantial gap that may be important for valuation focused investors.
Result: OVERVALUED
Our Discounted Cash Flow (DCF) analysis suggests Sanmina may be overvalued by 406.0%. Discover 909 undervalued stocks or create your own screener to find better value opportunities.
Approach 2: Sanmina Price vs Earnings
For profitable companies like Sanmina, the price to earnings (PE) ratio is a useful yardstick because it links what investors pay directly to the profits the business is generating today. In general, faster earnings growth and lower perceived risk justify a higher PE, while slower growth or more uncertainty tend to pull a fair PE lower.
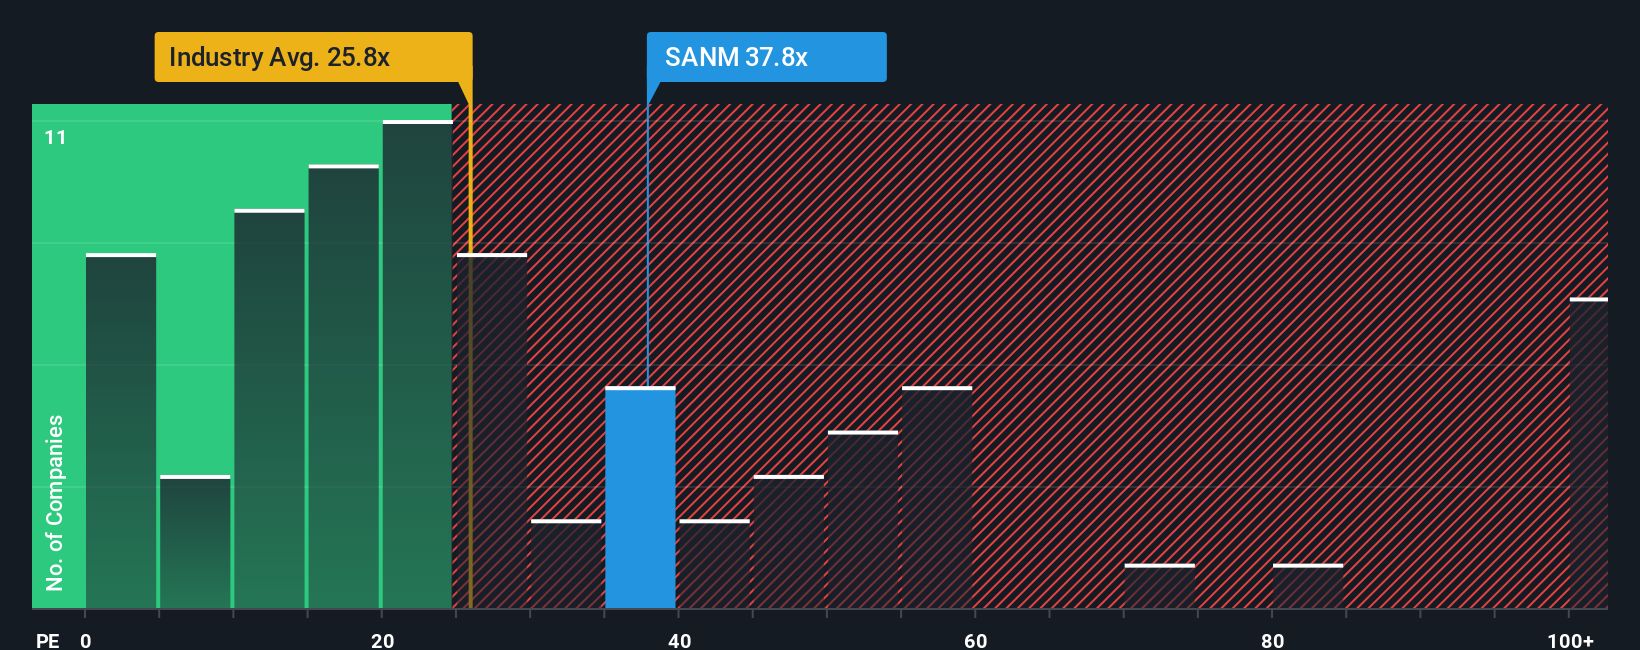
Sanmina currently trades at about 35.7x earnings. That is well above the broader Electronic industry average of roughly 24.9x, but slightly below the average of closer peers at about 38.5x. To go beyond simple comparisons, Simply Wall St uses a proprietary Fair Ratio, which estimates the PE you would expect for Sanmina once you factor in its earnings growth outlook, profitability, industry, market cap and specific risks.
This Fair Ratio sits around 38.3x, a touch higher than today’s 35.7x. Because it is tailored to Sanmina’s fundamentals, it is more informative than a blunt industry or peer average, which can be skewed by very different businesses. On this basis, the shares look modestly undervalued relative to what investors might normally be willing to pay for a company with Sanmina’s profile.
Result: UNDERVALUED
PE ratios tell one story, but what if the real opportunity lies elsewhere? Discover 1442 companies where insiders are betting big on explosive growth.
Upgrade Your Decision Making: Choose your Sanmina Narrative
Earlier we mentioned that there is an even better way to understand valuation, so let us introduce you to Narratives, a simple way to attach your story about Sanmina to the numbers behind its fair value by linking your view of future revenue, earnings and margins to a financial forecast and then to a fair value estimate. Narratives live inside the Simply Wall St Community page, where millions of investors use them as an easy, accessible tool to decide when to buy or sell by comparing their Fair Value to today’s Price, and they update dynamically whenever new information like earnings, news or guidance comes in. For example, one Sanmina Narrative on the platform might be highly optimistic, assuming AI rack assembly expansion and strong data center demand justify a fair value near $190 per share, while a more cautious Narrative might stress integration and customer concentration risks and land materially lower. By choosing which story you believe is more probable, you effectively choose the valuation and signals you will use to guide your own buy or sell decisions.
Do you think there's more to the story for Sanmina? Head over to our Community to see what others are saying!

This article by Simply Wall St is general in nature. We provide commentary based on historical data and analyst forecasts only using an unbiased methodology and our articles are not intended to be financial advice. It does not constitute a recommendation to buy or sell any stock, and does not take account of your objectives, or your financial situation. We aim to bring you long-term focused analysis driven by fundamental data. Note that our analysis may not factor in the latest price-sensitive company announcements or qualitative material. Simply Wall St has no position in any stocks mentioned.
Have feedback on this article? Concerned about the content? Get in touch with us directly. Alternatively, email editorial-team@simplywallst.com