

Assessing Fidelis Insurance Holdings After Specialty Lines Expansion and Recent Share Price Pullback
- If you are wondering whether Fidelis Insurance Holdings is a sleeper value play or a stock to avoid, you are in the right place. We are going to unpack what the current price is really telling us about the business.
- Despite a modest 0.6% gain year to date and a near flat 30 day move of 0.1%, the stock is still down 7.9% over the past year after a recent 5.0% pullback over the last week, which can leave investors unsure whether this is a buying opportunity or a warning sign.
- Recent news coverage has focused on Fidelis Insurance Holdings expanding its specialty lines footprint and refining its underwriting mix, which has drawn attention to how the company is positioning itself in a shifting insurance market. At the same time, commentary around reinsurance pricing cycles and catastrophe exposure has sharpened the market's focus on how resilient Fidelis' business model really is.
- Right now, Fidelis Insurance Holdings scores a solid 5/6 on our valuation checks, suggesting it screens as undervalued on most traditional measures. Next we will walk through those methods and then finish with a more complete way to think about what the market might be missing.
Approach 1: Fidelis Insurance Holdings Excess Returns Analysis
The Excess Returns model estimates what shareholders can earn above the company’s cost of equity, based on how efficiently Fidelis Insurance Holdings reinvests its capital over time.
For Fidelis, the starting point is a Book Value of $23.45 per share and a Stable EPS of $3.27 per share, derived from weighted future Return on Equity estimates from 5 analysts. With a Cost of Equity of $1.96 per share, the model calculates an Excess Return of $1.31 per share, indicating Fidelis is expected to generate value beyond what investors require as compensation for risk.
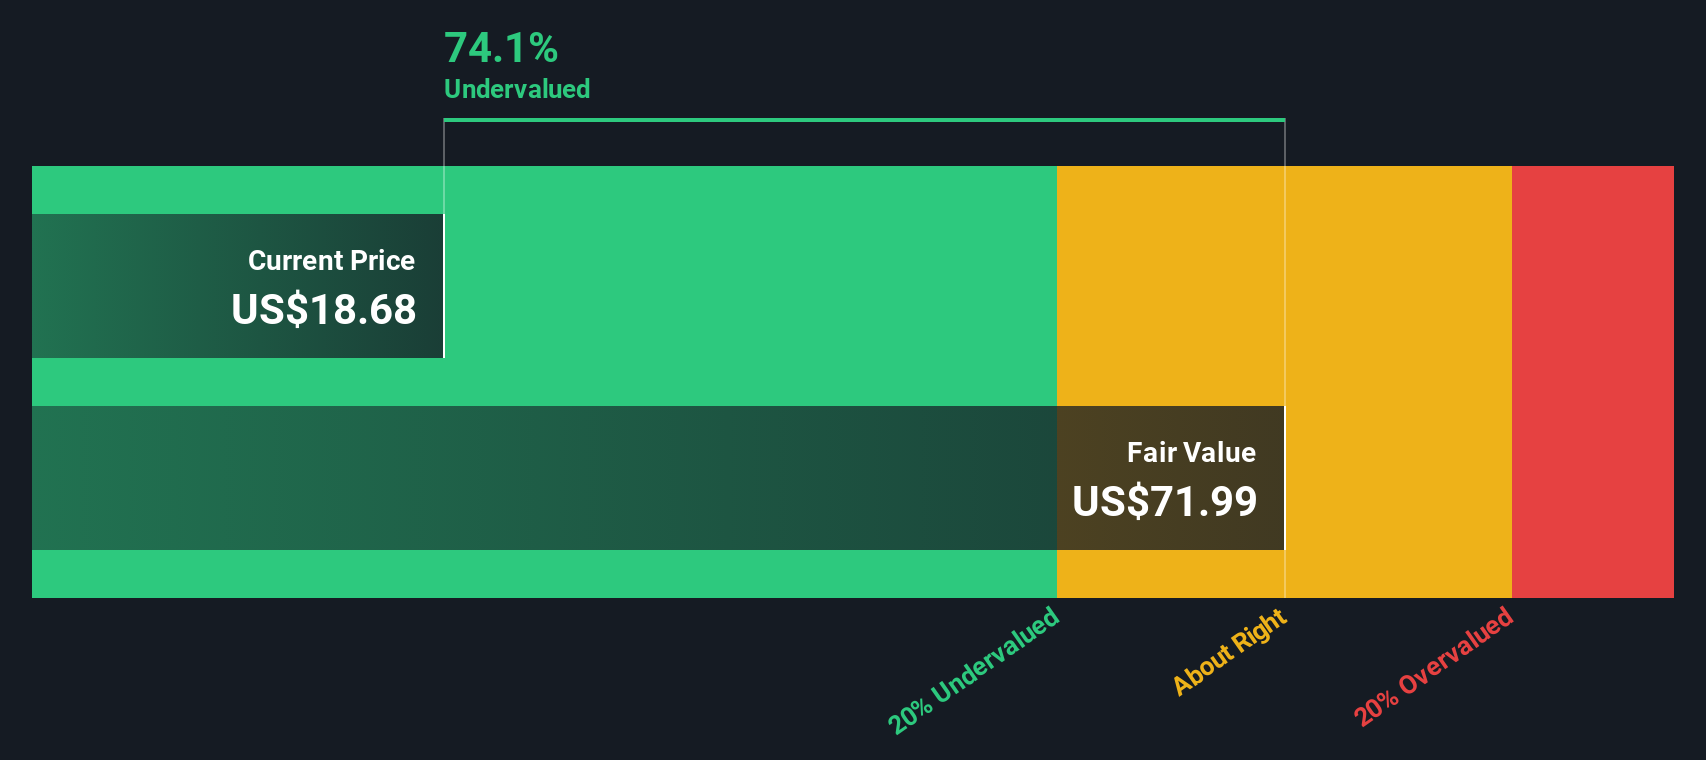
An Average Return on Equity of 11.61% and a projected Stable Book Value rising to $28.13 per share, based on 4 analysts’ estimates, are consistent with a thesis of steady value creation. Using these inputs in the Excess Returns framework produces an estimated intrinsic value of about $63.54 per share. Compared with the current share price, this implies the stock is roughly 71.5% undervalued, which suggests the market may be heavily discounting Fidelis’ ability to sustain attractive returns on equity.
Result: UNDERVALUED
Our Excess Returns analysis suggests Fidelis Insurance Holdings is undervalued by 71.5%. Track this in your watchlist or portfolio, or discover 909 more undervalued stocks based on cash flows.
Approach 2: Fidelis Insurance Holdings Price vs Sales
For insurers like Fidelis Insurance Holdings, the Price to Sales multiple is often the cleanest way to gauge value because reported earnings can swing with reserve adjustments and catastrophe losses, while revenue tends to better reflect the scale of the underlying franchise.
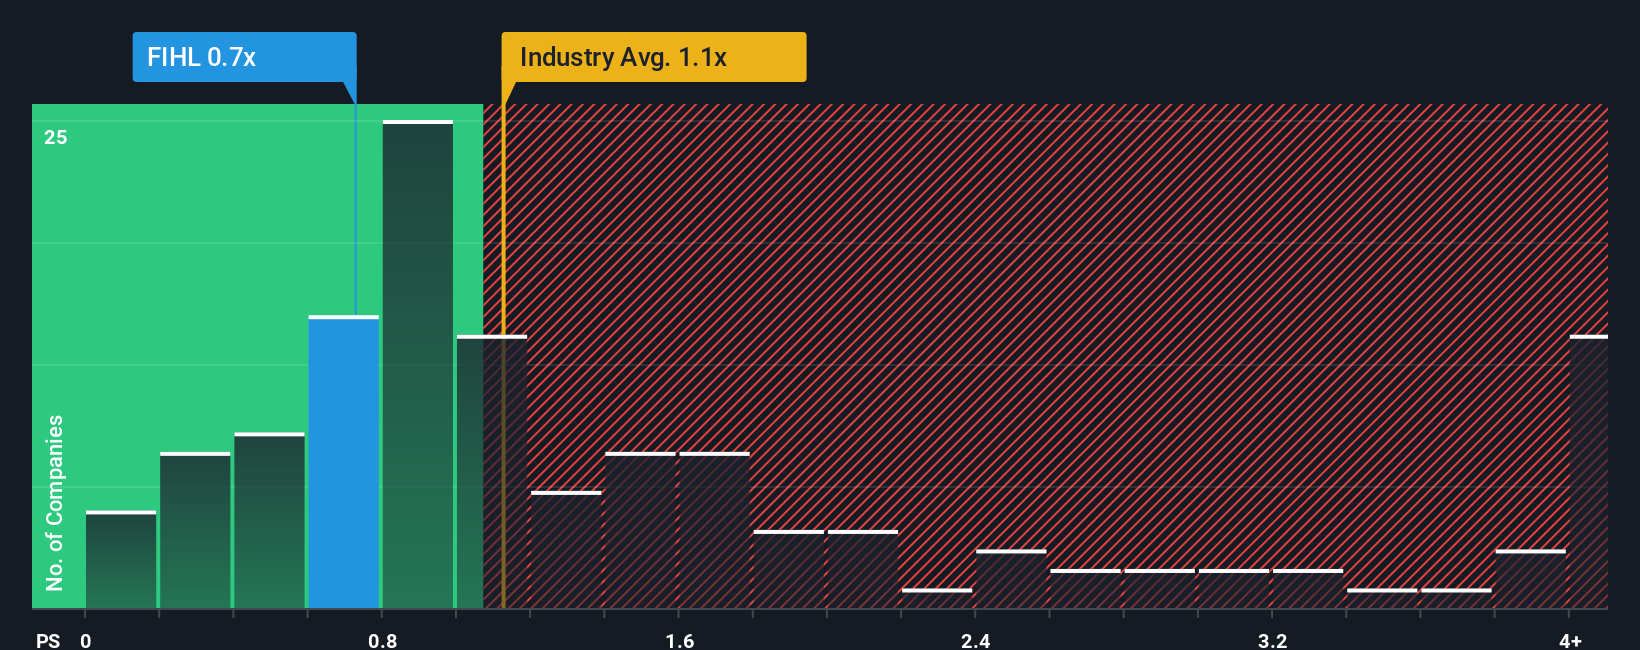
In general, faster and more reliable growth in premiums or fees, combined with lower risk, supports a higher Price to Sales ratio, while slower growth or lumpier results usually warrant a discount. Fidelis currently trades on a Price to Sales multiple of about 0.72x, which is below both the Insurance industry average of roughly 1.13x and the peer group average of around 1.56x. This suggests the market is cautious about its growth durability and risk profile.
Simply Wall St’s Fair Ratio is a proprietary estimate of what Fidelis’ Price to Sales multiple should be, given its growth outlook, profitability, risk, industry positioning and market cap. This is more informative than a simple comparison with peers because it adjusts for company specific strengths and weaknesses rather than assuming all insurers deserve the same multiple. Fidelis’ Fair Ratio is calculated at about 0.81x, modestly above the current 0.72x. On this metric, the shares screen as undervalued.
Result: UNDERVALUED
PS ratios tell one story, but what if the real opportunity lies elsewhere? Discover 1442 companies where insiders are betting big on explosive growth.
Upgrade Your Decision Making: Choose your Fidelis Insurance Holdings Narrative
Earlier we mentioned that there is an even better way to understand valuation, so let's introduce you to Narratives, a simple way for you to connect your view of Fidelis Insurance Holdings' future with a financial forecast and an explicit fair value estimate, all within the Simply Wall St Community page that millions of investors already use.
A Narrative is your story behind the numbers. You set assumptions for Fidelis' future revenue, earnings and margins, and the platform automatically translates that story into projected financials and a fair value that you can compare with today's share price to help inform your investment decisions.
Because Narratives on Simply Wall St are updated dynamically when new information like earnings or major news hits, you can quickly see how changes in Fidelis' underwriting trends, catastrophe exposure or competitive landscape might shift fair value and the gap to the current market price.
For example, one investor might build a bullish Narrative that assumes revenue growth a little above the current 11 percent forecast and a fair value near the high analyst target of about 27 dollars. A more cautious investor could assume slower growth, greater margin pressure and a fair value closer to the low target of 16 dollars, and both perspectives are visible and comparable in the Community.
Do you think there's more to the story for Fidelis Insurance Holdings? Head over to our Community to see what others are saying!

This article by Simply Wall St is general in nature. We provide commentary based on historical data and analyst forecasts only using an unbiased methodology and our articles are not intended to be financial advice. It does not constitute a recommendation to buy or sell any stock, and does not take account of your objectives, or your financial situation. We aim to bring you long-term focused analysis driven by fundamental data. Note that our analysis may not factor in the latest price-sensitive company announcements or qualitative material. Simply Wall St has no position in any stocks mentioned.
Have feedback on this article? Concerned about the content? Get in touch with us directly. Alternatively, email editorial-team@simplywallst.com