

Is Domino's Still Attractive After Recent Digital Expansion and Premium Valuation Signals?
- If you are wondering whether Domino's Pizza at around $427 a share is still attractive or if the easy money has already been made, this article will walk through what the current price really implies for future returns.
- Despite being down 1.8% year to date and 5.7% over the last year, the stock has quietly climbed 1.8% in the past week and 6.7% over the last month, reminding investors that sentiment around Domino's can shift quickly.
- Recent coverage has highlighted Domino's ongoing push into digital ordering and delivery innovation, along with its continued focus on store-level efficiency and franchise expansion. Together, these developments are reshaping how investors think about its growth runway. At the same time, commentary around competition from aggregators and changing consumer spending patterns is contributing to the market's reassessment of Domino's risk profile.
- Right now, Domino's scores only 0 out of 6 on our undervaluation checks. Next, we will unpack what that means across different valuation methods and why there may be an even better way to judge whether the stock is truly good value.
Domino's Pizza scores just 0/6 on our valuation checks. See what other red flags we found in the full valuation breakdown.
Approach 1: Domino's Pizza Discounted Cash Flow (DCF) Analysis
A Discounted Cash Flow model estimates what a company is worth by projecting the cash it can generate in the future and discounting those cash flows back to today, reflecting the time value of money and risk.
For Domino's Pizza, the model starts with last twelve months Free Cash Flow of about $622.3 million and uses analyst forecasts for the next few years, then extends those trends further out. By 2035, Simply Wall St's extrapolated projections suggest Free Cash Flow could reach roughly $926.8 million, with values gradually stepping up each year as the business grows.
When all of these projected cash flows are discounted back to today using a 2 Stage Free Cash Flow to Equity framework, the estimated intrinsic value comes out at roughly $350.56 per share. With Domino's currently trading around $427, the DCF implies the stock is about 21.8% overvalued on this basis. This indicates that investors may be paying a premium to its cash flow fundamentals.
Result: OVERVALUED
Our Discounted Cash Flow (DCF) analysis suggests Domino's Pizza may be overvalued by 21.8%. Discover 909 undervalued stocks or create your own screener to find better value opportunities.

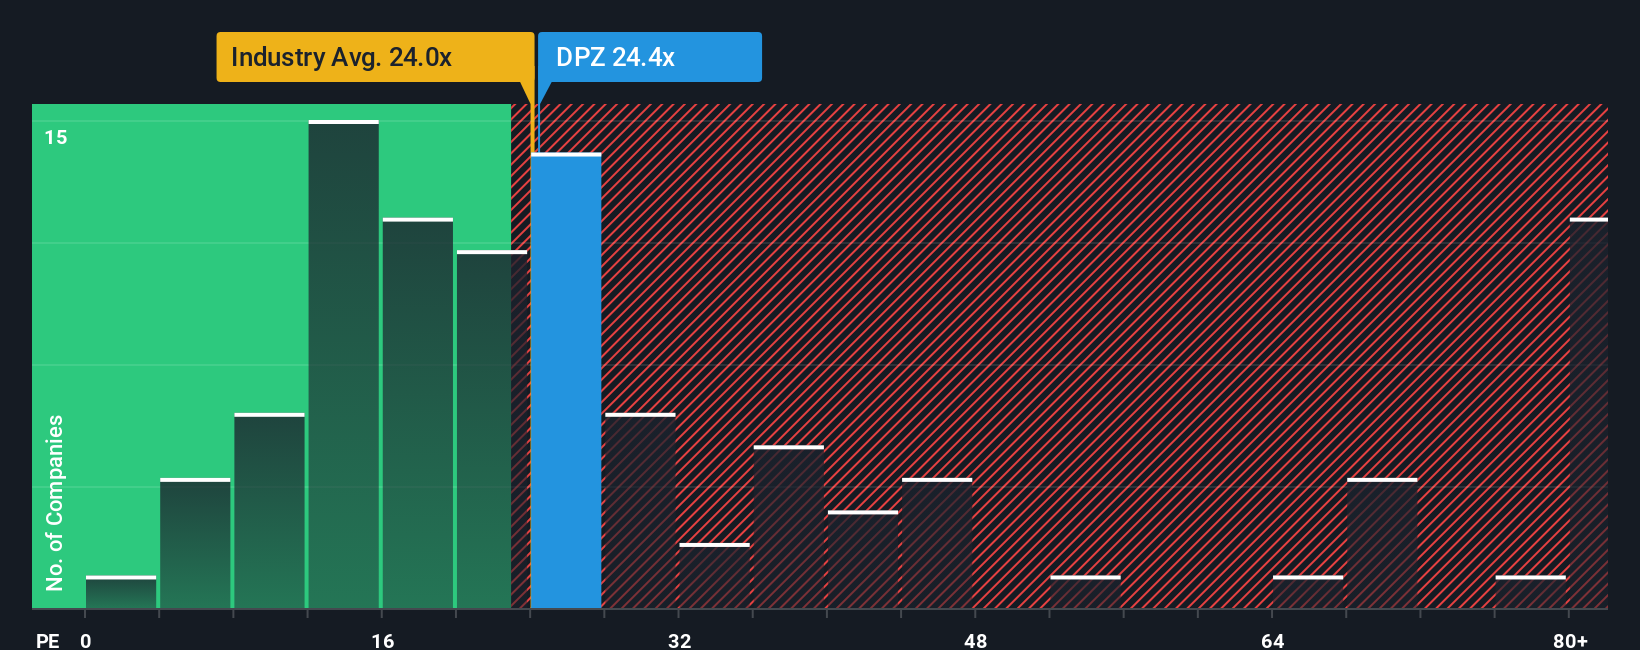
Approach 2: Domino's Pizza Price vs Earnings
For profitable, mature businesses like Domino's Pizza, the Price to Earnings (PE) ratio is a useful way to gauge value because it links the share price directly to the earnings the company is generating today. Investors are generally willing to pay a higher PE for companies with stronger growth prospects or lower perceived risk, and a lower PE for those with weaker growth or higher uncertainty. Domino's currently trades at about 24.48x earnings, which is above the Hospitality industry average of roughly 21.23x and also higher than the peer average of around 23.15x, suggesting the market is already assigning it a quality and growth premium. Simply Wall St's proprietary Fair Ratio for Domino's is 20.70x, which reflects what investors might reasonably pay given its specific mix of earnings growth, margins, industry position, size and risk profile. This Fair Ratio is more informative than a simple comparison with peers or industry averages because it is tailored to Domino's fundamentals rather than broad groupings. Comparing the Fair Ratio of 20.70x with the actual PE of 24.48x points to the shares trading at a notable premium on this earnings-based lens.
Result: OVERVALUED
PE ratios tell one story, but what if the real opportunity lies elsewhere? Discover 1442 companies where insiders are betting big on explosive growth.
Upgrade Your Decision Making: Choose your Domino's Pizza Narrative
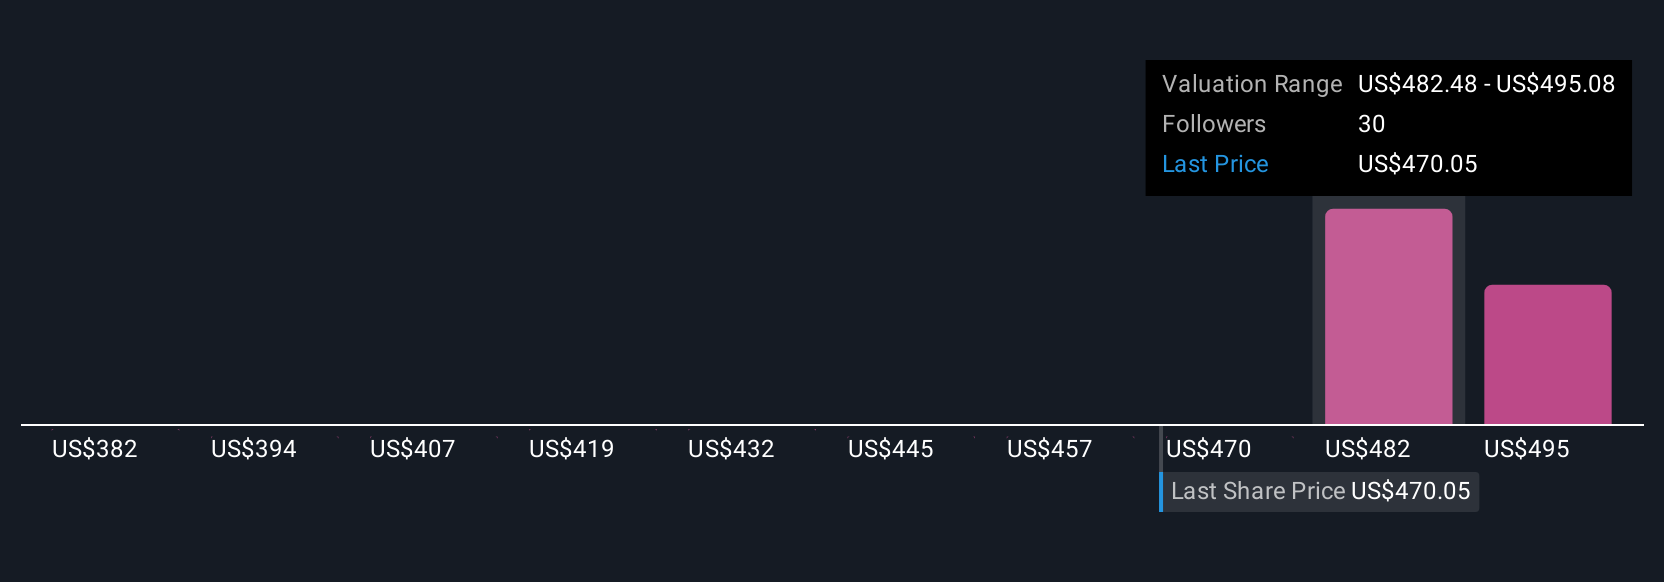
Earlier we mentioned that there is an even better way to understand valuation, so let us introduce you to Narratives, a simple framework on Simply Wall St’s Community page that lets you turn your view of Domino's Pizza into a story backed by numbers. It links what you believe about its digital expansion, store growth and competitive position to explicit forecasts for revenue, earnings and margins, and then to a Fair Value you can compare with today’s share price to see whether it looks like a buy or a sell. The platform keeps that Narrative updated whenever new news or earnings arrive. This means two investors can look at the same stock and reach very different but clearly explained conclusions. For example, one Narrative might argue that robust delivery partnerships, menu innovation and international densification justify a Fair Value closer to the most bullish target of about $594. Another, more cautious Narrative might focus on flat pizza category growth, tougher international economics and margin pressure to arrive at a Fair Value nearer the most bearish target of roughly $340.
Do you think there's more to the story for Domino's Pizza? Head over to our Community to see what others are saying!
This article by Simply Wall St is general in nature. We provide commentary based on historical data and analyst forecasts only using an unbiased methodology and our articles are not intended to be financial advice. It does not constitute a recommendation to buy or sell any stock, and does not take account of your objectives, or your financial situation. We aim to bring you long-term focused analysis driven by fundamental data. Note that our analysis may not factor in the latest price-sensitive company announcements or qualitative material. Simply Wall St has no position in any stocks mentioned.
Have feedback on this article? Concerned about the content? Get in touch with us directly. Alternatively, email editorial-team@simplywallst.com