

Is Ally Financial’s Valuation Still Attractive After Its Strong 2025 Share Price Rally?
- Wondering if Ally Financial is still a smart buy at today’s price, or if most of the easy gains are already gone? This breakdown will help you decide whether the current market value really makes sense.
- The stock has been grinding higher, with the share price at $42.39 after rising 2.6% over the last week, 6.1% over the last month, and 18.5% year to date, building on strong multi year returns.
- Recent headlines have focused on Ally’s push deeper into digital banking and auto finance, along with ongoing efforts to improve credit quality and optimize funding costs. These themes are shaping how investors think about the company’s growth runway and risk profile, and they help explain why sentiment around the stock has been shifting.
- Despite all that, Ally scores just 1/6 on our valuation checks, suggesting that by some traditional measures it does not look broadly undervalued. Next we will walk through the main valuation approaches, then finish with a more holistic way to judge whether the stock’s current price really reflects its long term potential.
Ally Financial scores just 1/6 on our valuation checks. See what other red flags we found in the full valuation breakdown.
Approach 1: Ally Financial Excess Returns Analysis
The Excess Returns model looks at how much profit Ally Financial can generate above the return that investors require on its equity capital. Instead of focusing on cash flows, it measures whether management is creating value on each dollar of shareholder equity, and how sustainably that can continue over time.
For Ally, the model uses a Book Value of $41.56 per share and a Stable EPS of $4.79 per share, based on weighted future Return on Equity estimates from 10 analysts. The Cost of Equity is estimated at $5.29 per share, implying an Excess Return of negative $0.50 per share. In other words, projected earnings slightly trail the required return, even though the Average Return on Equity stands at 10.55%. Stable Book Value is projected at $45.40 per share, informed by estimates from 9 analysts.
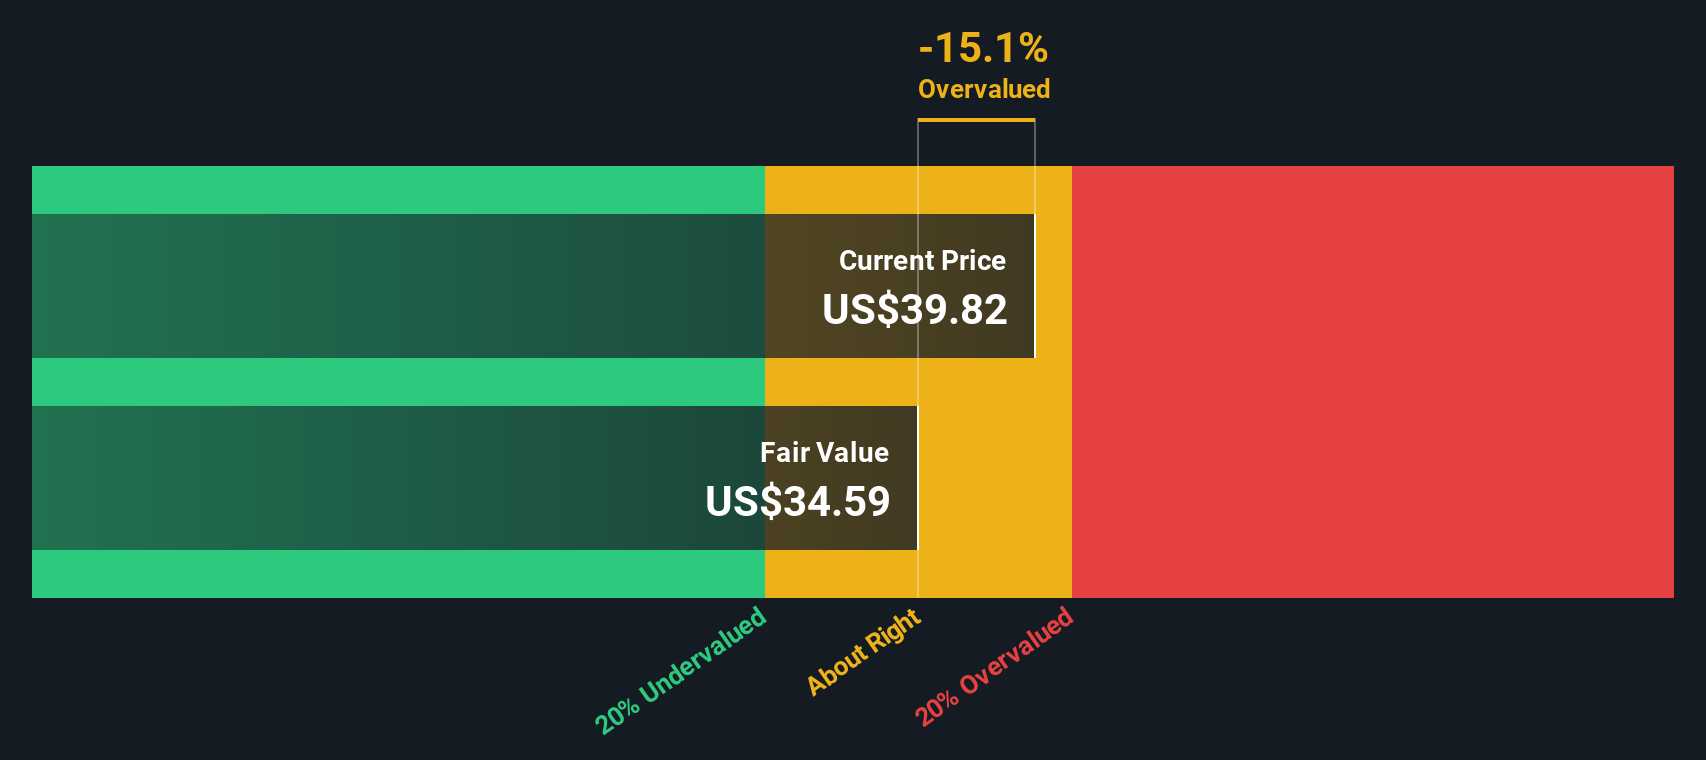
Putting these inputs together, the Excess Returns valuation points to an intrinsic value of about $39.45 per share, roughly 7.5% below the current market price. In this framework, Ally appears modestly overvalued rather than clearly cheap.
Result: ABOUT RIGHT
Ally Financial is fairly valued according to our Excess Returns, but this can change at a moment's notice. Track the value in your watchlist or portfolio and be alerted on when to act.
Approach 2: Ally Financial Price vs Earnings
For a profitable lender like Ally, the price to earnings ratio is a straightforward way to gauge what investors are willing to pay today for each dollar of current earnings. In general, faster growth and lower risk justify a higher PE, while slower growth or higher credit risk usually deserve a lower one.
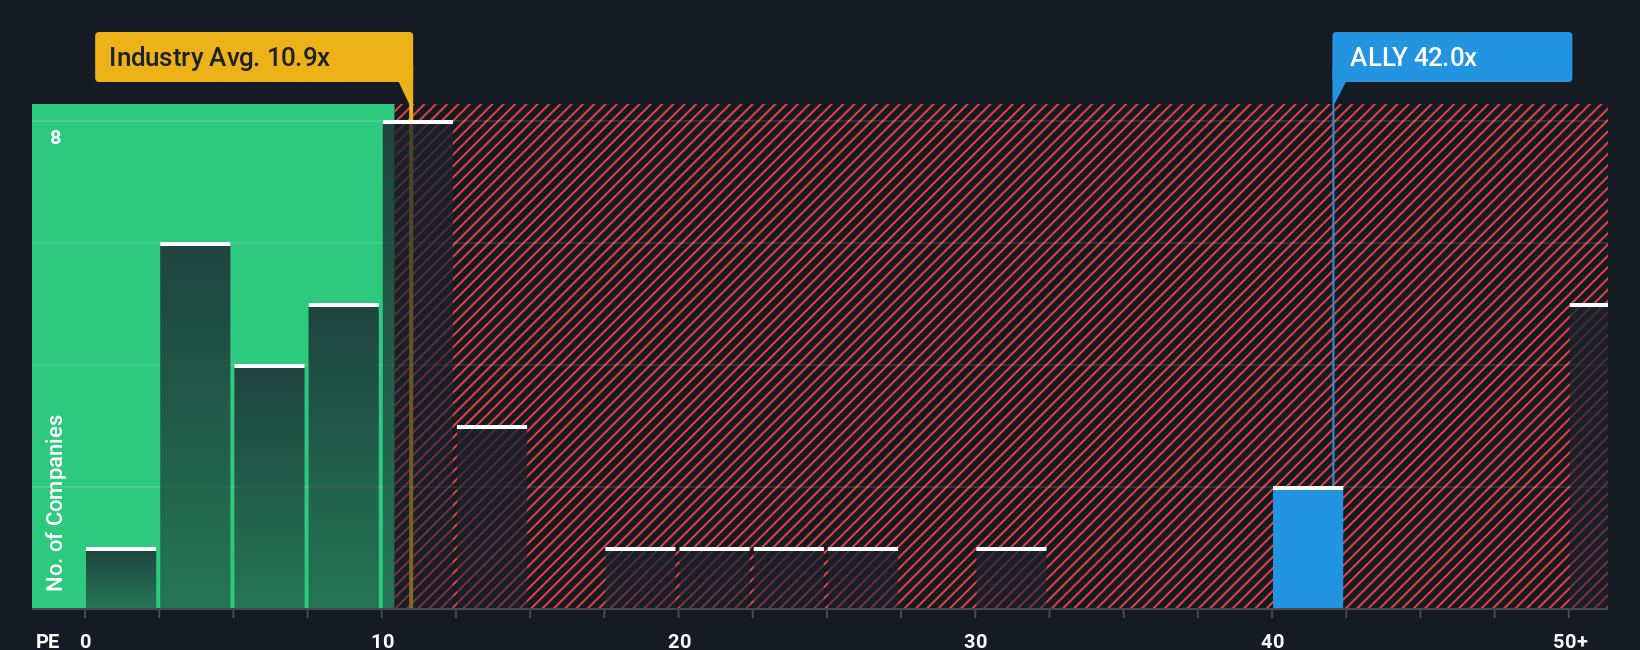
Ally currently trades on about 24.9x earnings, which is well above the Consumer Finance industry average of around 10.1x and also below the broader peer group average of roughly 47.9x. To move beyond these blunt comparisons, Simply Wall St uses a Fair Ratio, an estimate of what Ally’s PE should be given its specific growth outlook, profitability, industry, market size and risk profile.
This Fair Ratio for Ally is 20.6x, which is more tailored than simply lining the stock up against generic sector or peer averages because it bakes in company specific factors like earnings growth and risk. With the current 24.9x PE sitting meaningfully above the 20.6x Fair Ratio, the shares look somewhat expensive on this metric.
Result: OVERVALUED
PE ratios tell one story, but what if the real opportunity lies elsewhere? Discover 1440 companies where insiders are betting big on explosive growth.
Upgrade Your Decision Making: Choose your Ally Financial Narrative
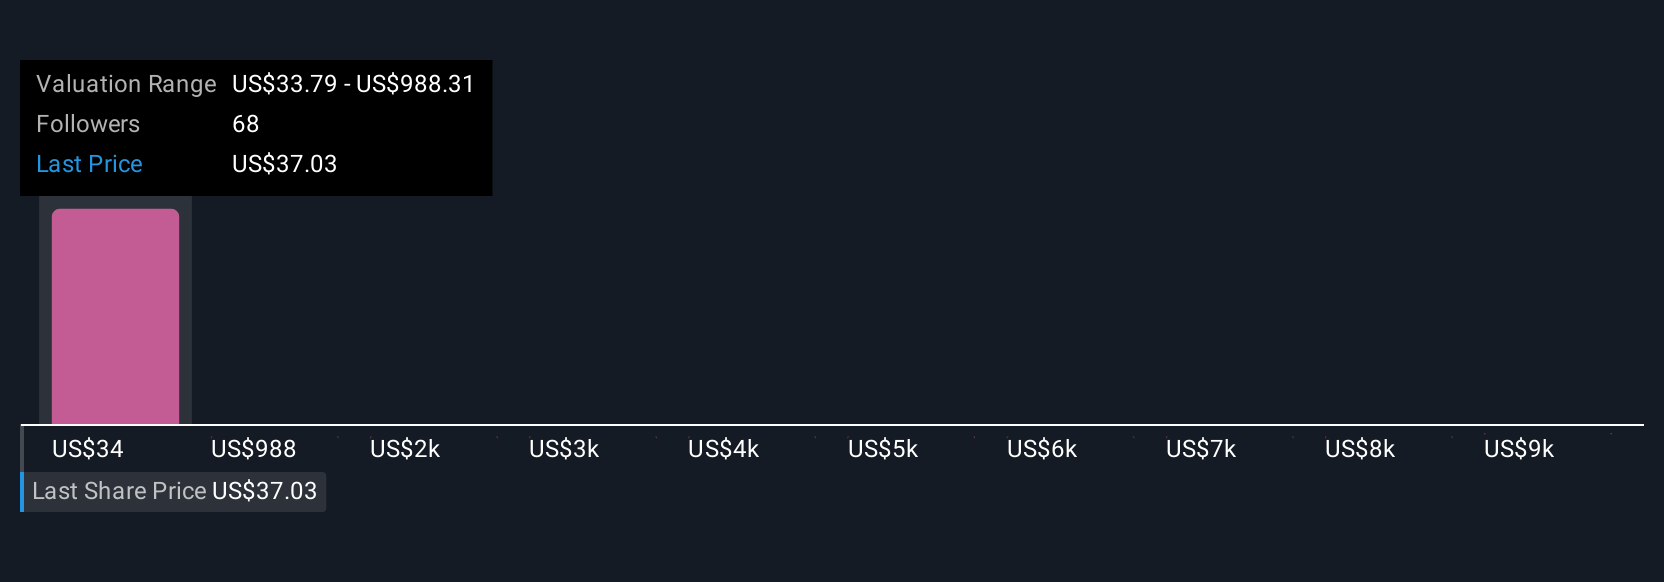
Earlier we mentioned that there is an even better way to understand valuation, so let us introduce you to Narratives, an easy tool on Simply Wall St’s Community page. Millions of investors use Narratives to connect a company’s story to a financial forecast and then to a fair value. They do this by describing their view of Ally’s future growth, margins and risks, translating that view into forecasts for revenue, earnings and profitability, and finally comparing the resulting Fair Value to today’s Price to see whether it looks like a buy, hold or sell. Those Narratives update dynamically as new information such as earnings, credit data or index changes comes in. One investor might build a bullish Ally Narrative around improving credit trends and a Fair Value near $59, while another might take a more cautious stance that emphasizes competitive and regulatory risks and lands closer to $39. This gives you a clear, numbers based way to choose the story that best matches your own expectations.
Do you think there's more to the story for Ally Financial? Head over to our Community to see what others are saying!
This article by Simply Wall St is general in nature. We provide commentary based on historical data and analyst forecasts only using an unbiased methodology and our articles are not intended to be financial advice. It does not constitute a recommendation to buy or sell any stock, and does not take account of your objectives, or your financial situation. We aim to bring you long-term focused analysis driven by fundamental data. Note that our analysis may not factor in the latest price-sensitive company announcements or qualitative material. Simply Wall St has no position in any stocks mentioned.
Have feedback on this article? Concerned about the content? Get in touch with us directly. Alternatively, email editorial-team@simplywallst.com