

Is It Too Late To Consider Morgan Stanley After A 41.5% 2025 Rally?
- If you are wondering whether Morgan Stanley at $176.51 is still good value after such a strong run, you are not alone. That is exactly what we will unpack here.
- The stock has climbed 4.0% over the last week, 6.9% in the past month, and an impressive 41.5% year to date, adding to gains of 39.6% over 1 year, 118.3% over 3 years, and 227.0% over 5 years.
- Those moves have come as investors focus on big picture themes like the evolving interest rate backdrop and expectations for deal making, trading activity, and wealth management flows across Wall Street. Morgan Stanley in particular has been in the spotlight as markets debate how durable its fee based businesses are and what that means for its long term earnings power.
- Despite that backdrop, the stock currently scores a 3/6 valuation check. This suggests it looks undervalued on some measures but not others. We will walk through the main valuation approaches traders and long term investors use today, then finish with a more holistic way to think about what the market might be missing.
Approach 1: Morgan Stanley Excess Returns Analysis
The Excess Returns model looks at how much value Morgan Stanley can create above the return that shareholders demand on their equity, rather than focusing on cash flows alone. It asks whether the bank can keep earning attractive returns on the capital invested in its business.
For Morgan Stanley, the model starts with a Book Value of $62.98 per share and an Average Return on Equity of 16.37%. That supports a Stable EPS estimate of $11.15 per share, based on weighted future ROE forecasts from 13 analysts. Against a Cost of Equity of $6.68 per share, this implies an Excess Return of $4.47 per share, meaning the bank is expected to generate returns comfortably above its cost of capital. The Stable Book Value is projected at $68.11 per share, based on estimates from 14 analysts.
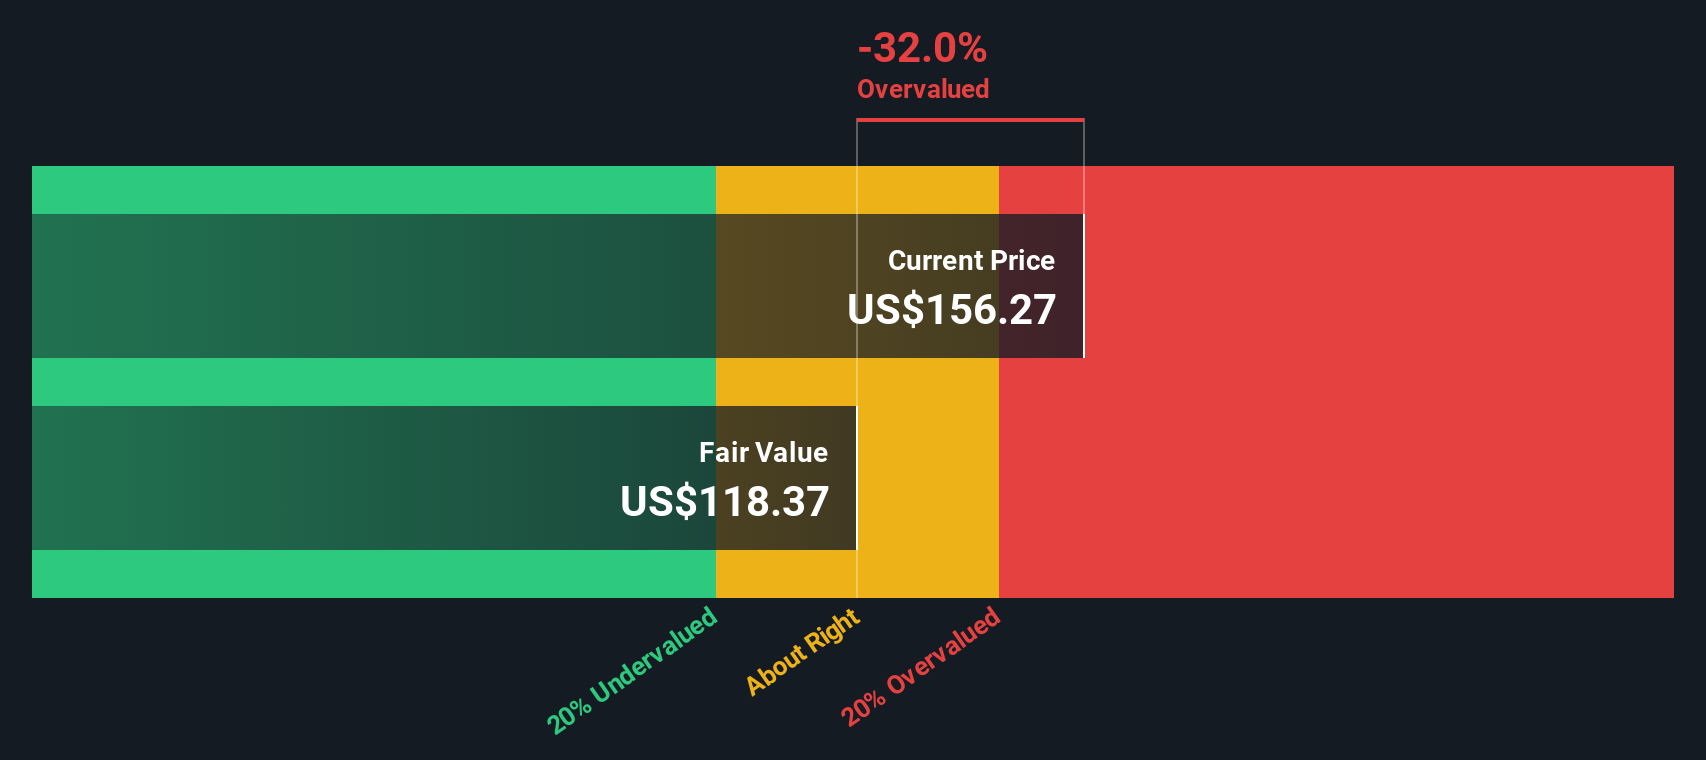
Putting these inputs together, the Excess Returns valuation produces an intrinsic value of about $136.39 per share. This is roughly 29.4% below the current price of $176.51, so on this framework Morgan Stanley appears meaningfully overvalued.
Result: OVERVALUED
Our Excess Returns analysis suggests Morgan Stanley may be overvalued by 29.4%. Discover 906 undervalued stocks or create your own screener to find better value opportunities.
Approach 2: Morgan Stanley Price vs Earnings
For consistently profitable companies like Morgan Stanley, the price to earnings ratio is a useful way to gauge how much investors are willing to pay today for each dollar of current earnings. It links directly to profitability and is widely used across the Capital Markets industry, which makes comparisons more intuitive.
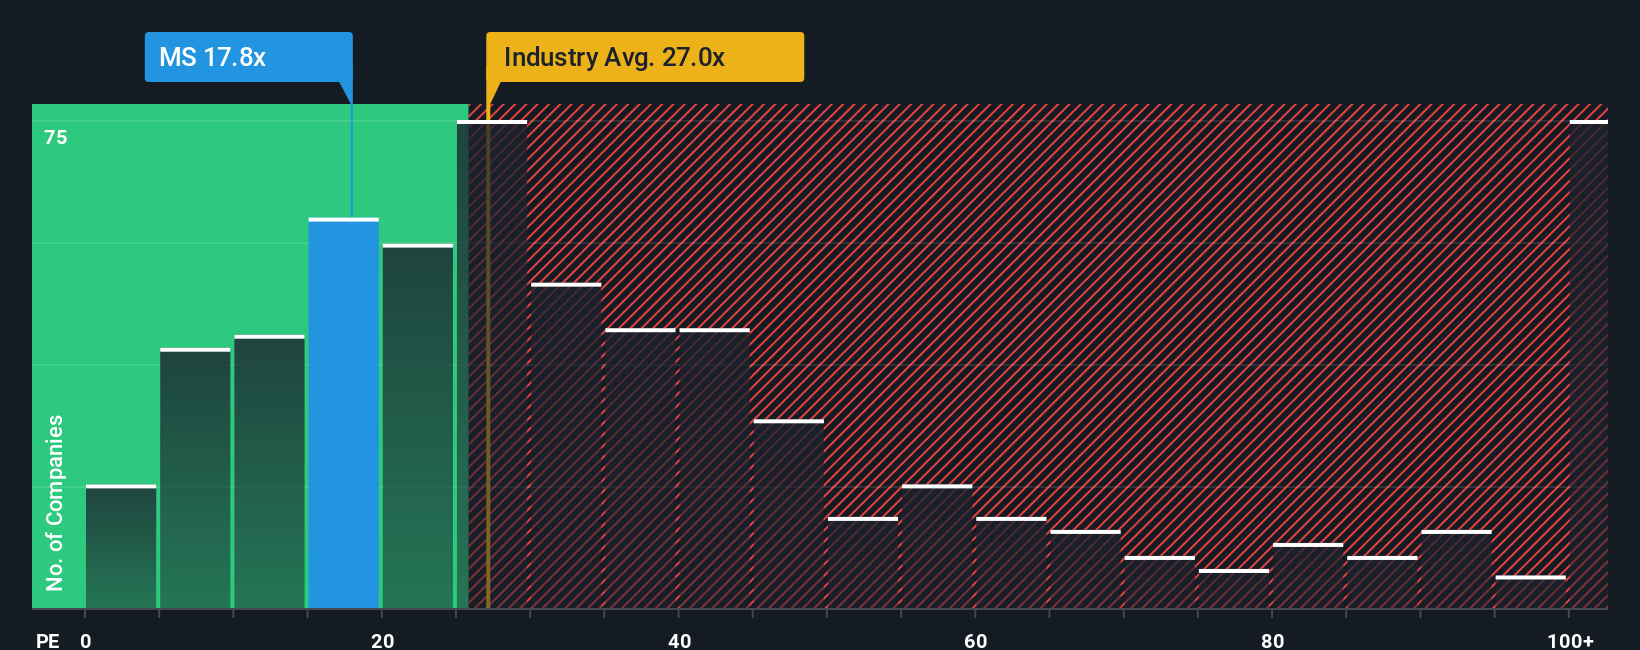
In simple terms, faster earnings growth and lower perceived risk usually justify a higher, or more generous, PE ratio, while slower growth or higher risk call for a lower multiple. Morgan Stanley currently trades on about 18.0x earnings, below the broader Capital Markets industry average of 24.0x and well under the peer group average of roughly 31.0x, which might initially suggest the stock is conservatively valued.
Simply Wall St’s Fair Ratio framework goes a step further by estimating what a reasonable PE should be for this specific business, given its earnings growth prospects, profitability, risk profile, industry and market cap. For Morgan Stanley, that Fair Ratio comes out at around 19.0x. Because this tailored benchmark incorporates more of the company’s fundamentals than a simple industry or peer comparison, it is a more robust guide. With the actual PE of 18.0x sitting modestly below the 19.0x Fair Ratio, the shares look slightly undervalued on this lens.
Result: UNDERVALUED
PE ratios tell one story, but what if the real opportunity lies elsewhere? Discover 1442 companies where insiders are betting big on explosive growth.
Upgrade Your Decision Making: Choose your Morgan Stanley Narrative
Earlier we mentioned that there is an even better way to understand valuation, so let us introduce you to Narratives, a simple framework that lets you connect your view of Morgan Stanley’s story with concrete numbers like future revenue, earnings, margins and the fair value you think is reasonable.
A Narrative on Simply Wall St is your own storyline for the company, where you spell out how you expect the business to evolve, translate that story into a financial forecast, and then see the fair value that falls out of those assumptions.
This turns investing into a clear sequence: from story, to forecast, to fair value, and then to a decision about whether today’s share price offers enough upside or downside to justify buying, holding, or selling.
Narratives live on Simply Wall St’s Community page. They are easy to create and compare, and they automatically update when new information, like earnings or major news, changes the outlook.
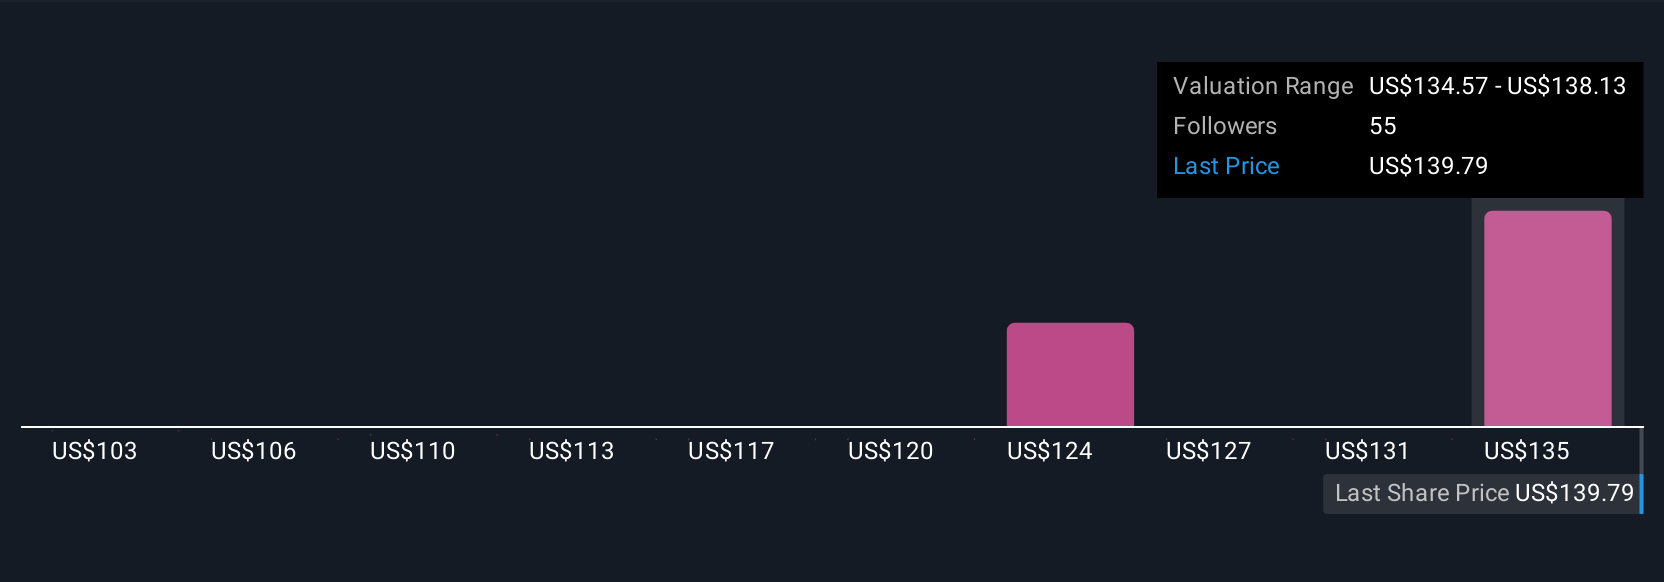
For example, one Morgan Stanley Narrative might lean on steady 5% annual revenue growth, firm margins around 23%, and a fair value near $168, while a more cautious view might expect slower growth, softer margins, and a fair value closer to $122.
Do you think there's more to the story for Morgan Stanley? Head over to our Community to see what others are saying!
This article by Simply Wall St is general in nature. We provide commentary based on historical data and analyst forecasts only using an unbiased methodology and our articles are not intended to be financial advice. It does not constitute a recommendation to buy or sell any stock, and does not take account of your objectives, or your financial situation. We aim to bring you long-term focused analysis driven by fundamental data. Note that our analysis may not factor in the latest price-sensitive company announcements or qualitative material. Simply Wall St has no position in any stocks mentioned.
Have feedback on this article? Concerned about the content? Get in touch with us directly. Alternatively, email editorial-team@simplywallst.com