

Does Stryker’s Premium Valuation Still Make Sense After Recent Share Price Volatility?
- Wondering whether Stryker is still worth buying at around $364 a share, or if most of the upside has already been priced in? You are not alone. This article is going to unpack what that price really implies.
- The stock has been a bit choppy lately, slipping about 1.9% over the last week but still up 1.8% in the last month and 1.5% year to date. Longer term returns of 53.3% over 3 years and 65.1% over 5 years show how powerful the story has been for patient holders, even after a 4.6% dip over the past year.
- Behind these moves, investors have been reacting to ongoing momentum in Stryker's medical technology portfolio and continued demand for its surgical and orthopaedic products, as hospitals keep investing in higher tech solutions. At the same time, the broader healthcare and medtech sector has been repricing as markets reassess growth expectations and risk appetite. This naturally feeds into how Stryker is being valued.
- Despite that backdrop, Stryker currently scores a 0/6 on our valuation checks, suggesting the market may already be demanding a premium. Next we will walk through traditional valuation approaches and then finish with a more holistic way to think about what this business is really worth.
Stryker scores just 0/6 on our valuation checks. See what other red flags we found in the full valuation breakdown.
Approach 1: Stryker Discounted Cash Flow (DCF) Analysis
A Discounted Cash Flow model estimates what a company is worth by projecting the cash it can generate in the future and discounting those cash flows back to today, using a rate that reflects risk and the time value of money.
For Stryker, the latest twelve months Free Cash Flow stands at about $4.1 billion. Using a 2 Stage Free Cash Flow to Equity approach, analyst forecasts and extrapolations see cash flow rising to roughly $7.2 billion by 2035, with the nearer term years in between also showing steady growth. Analysts directly provide future cash flow estimates in dollars for the next few years, and Simply Wall St extends this trajectory further out to build a full 10 year view.
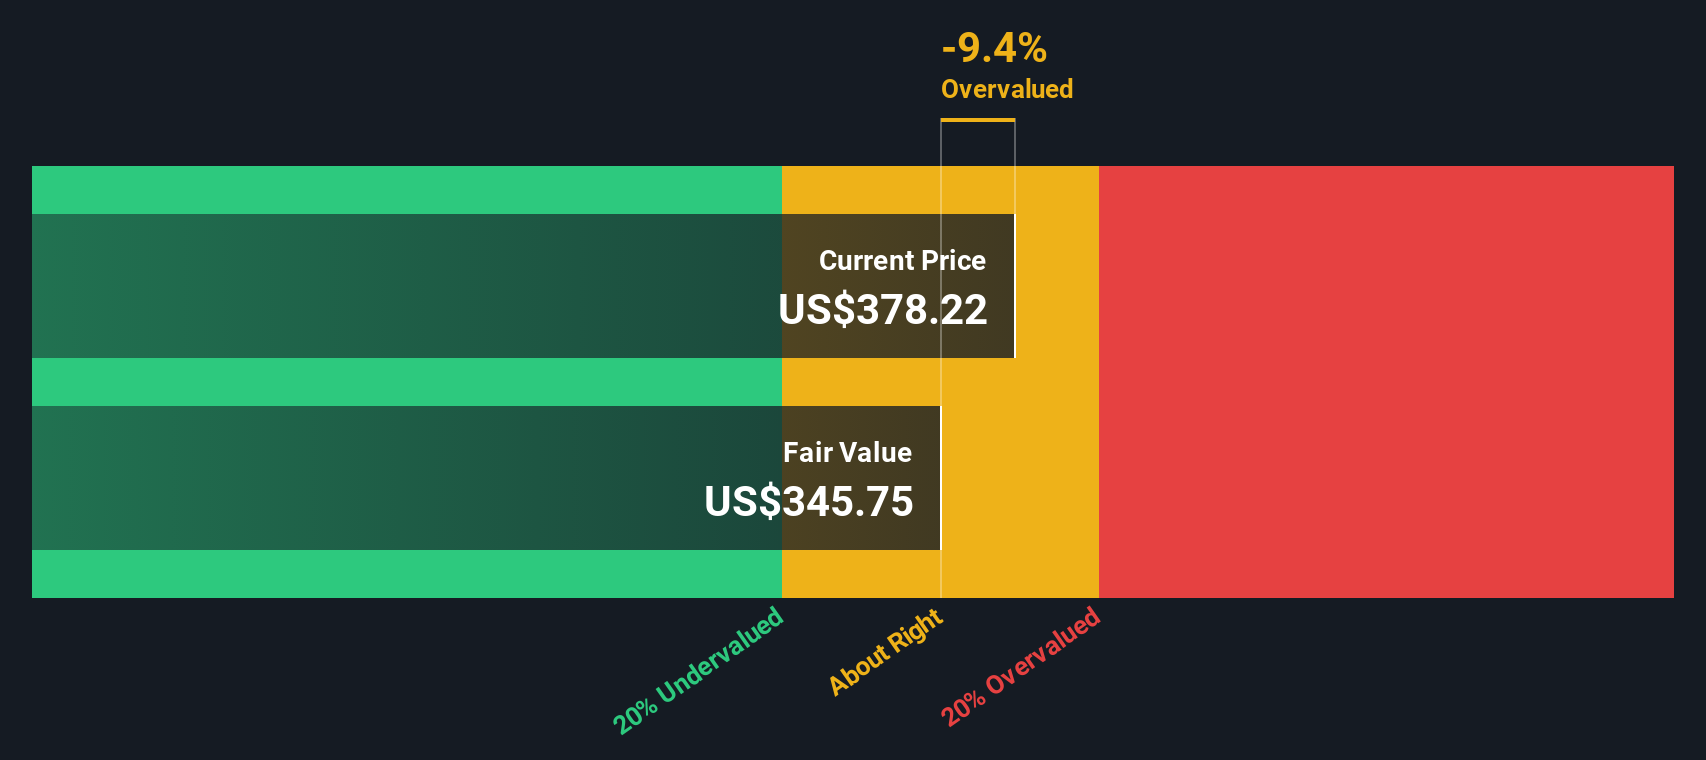
When those projected cash flows are discounted back, the model arrives at an intrinsic value of roughly $301 per share. Versus a market price around $364, this implies the stock is about 20.8% overvalued on a cash flow basis, suggesting expectations in the share price are already quite elevated.
Result: OVERVALUED
Our Discounted Cash Flow (DCF) analysis suggests Stryker may be overvalued by 20.8%. Discover 906 undervalued stocks or create your own screener to find better value opportunities.
Approach 2: Stryker Price vs Earnings
For profitable, established businesses like Stryker, the Price to Earnings ratio is a useful yardstick because it directly links what investors are paying today to the profits the company is generating. In general, faster growth and lower risk justify a higher PE, while slower or more volatile earnings tend to pull a fair multiple lower.
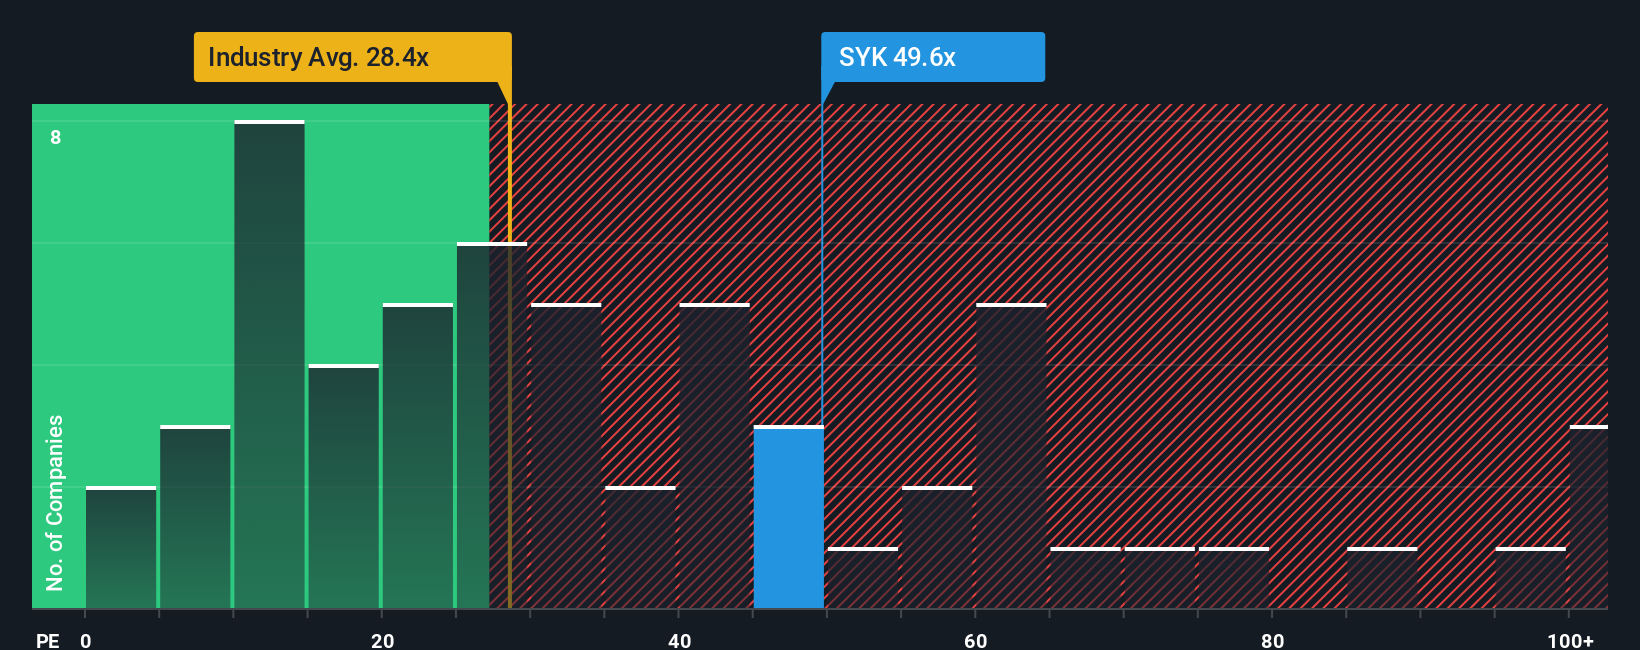
Stryker currently trades on about 47.3x earnings, which is well above both the broader Medical Equipment industry average of roughly 29.2x and the peer group average of about 42.2x. To move beyond these blunt comparisons, Simply Wall St calculates a Fair Ratio, the PE you might reasonably expect once you factor in Stryker s specific earnings growth outlook, profitability, size, industry positioning and risk profile. For Stryker, that Fair Ratio is estimated at around 37.2x.
Because the current 47.3x PE sits meaningfully above this 37.2x Fair Ratio, the shares look expensive on an earnings based view, even after allowing for the company s quality and growth prospects.
Result: OVERVALUED
PE ratios tell one story, but what if the real opportunity lies elsewhere? Discover 1442 companies where insiders are betting big on explosive growth.
Upgrade Your Decision Making: Choose your Stryker Narrative
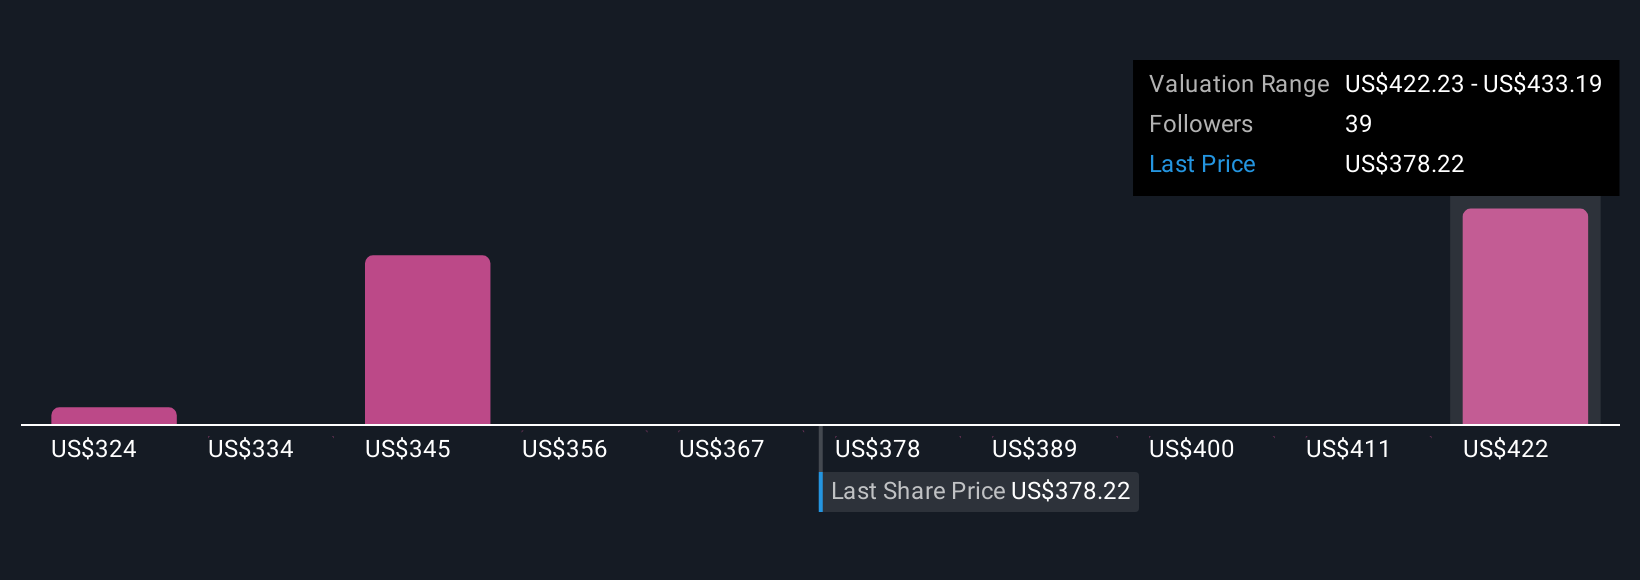
Earlier we mentioned that there is an even better way to understand valuation, so let us introduce you to Narratives, a simple way to connect your view of Stryker s business to the numbers behind its fair value. A Narrative is your story for the company, expressed as your assumptions about future revenue growth, earnings, and margins, which then flows through to a financial forecast and an estimate of fair value. On Simply Wall St, Narratives are an easy, accessible tool on the Community page, used by millions of investors to turn qualitative views into quantitative outcomes. They can help you compare the Fair Value from your Narrative to Stryker s current share price, and they automatically update as new information, like earnings or regulatory news, comes in. For example, one Stryker investor might build a bullish Narrative around strong innovation and demographic tailwinds that supports a fair value closer to $465, while another focuses on regulatory and pricing risks and arrives nearer $316. Seeing where your own Narrative sits on that spectrum can make your decision making far more deliberate.
Do you think there's more to the story for Stryker? Head over to our Community to see what others are saying!
This article by Simply Wall St is general in nature. We provide commentary based on historical data and analyst forecasts only using an unbiased methodology and our articles are not intended to be financial advice. It does not constitute a recommendation to buy or sell any stock, and does not take account of your objectives, or your financial situation. We aim to bring you long-term focused analysis driven by fundamental data. Note that our analysis may not factor in the latest price-sensitive company announcements or qualitative material. Simply Wall St has no position in any stocks mentioned.
Have feedback on this article? Concerned about the content? Get in touch with us directly. Alternatively, email editorial-team@simplywallst.com