


- Investors may be wondering whether AllianceBernstein Holding at around US$38.61 is offering good value right now, or if the easy money has already been made.
- The stock is down 4.3% over the past week, roughly flat year to date with a 0.1% decline, and has returned 2.8% over the last year and 50.4% over three years. Together, these figures give a mixed picture of recent momentum and risk sentiment.
- Recent coverage of AllianceBernstein has focused on its role as an asset manager, with investors paying close attention to how market conditions influence assets under management and fee income. This context helps explain why shorter term price moves can look quite different to the longer term 34.7% return over five years.
- On Simply Wall St's 6 point valuation checklist, AllianceBernstein scores 2 out of 6. The rest of this article will compare different valuation methods to that score and finish with a broader way to think about what the stock might be worth.
AllianceBernstein Holding scores just 2/6 on our valuation checks. See what other red flags we found in the full valuation breakdown.
Approach 1: AllianceBernstein Holding Excess Returns Analysis
The Excess Returns model looks at how much profit a company is expected to generate above the return that shareholders require, then capitalizes those extra profits into an estimate of fair value per share.
For AllianceBernstein Holding, the starting point is a book value of $13.42 per share and a stable book value estimate of $18.00 per share, both based on median figures from the past 5 years. Using the same period, the model applies a stable EPS of $2.76 per share and an average return on equity of 15.31%.
The cost of equity is set at $1.67 per share, which implies an excess return of $1.08 per share. In simple terms, the model assumes the company can earn more on its equity base than investors require, and that this gap will persist at a stable level over time.
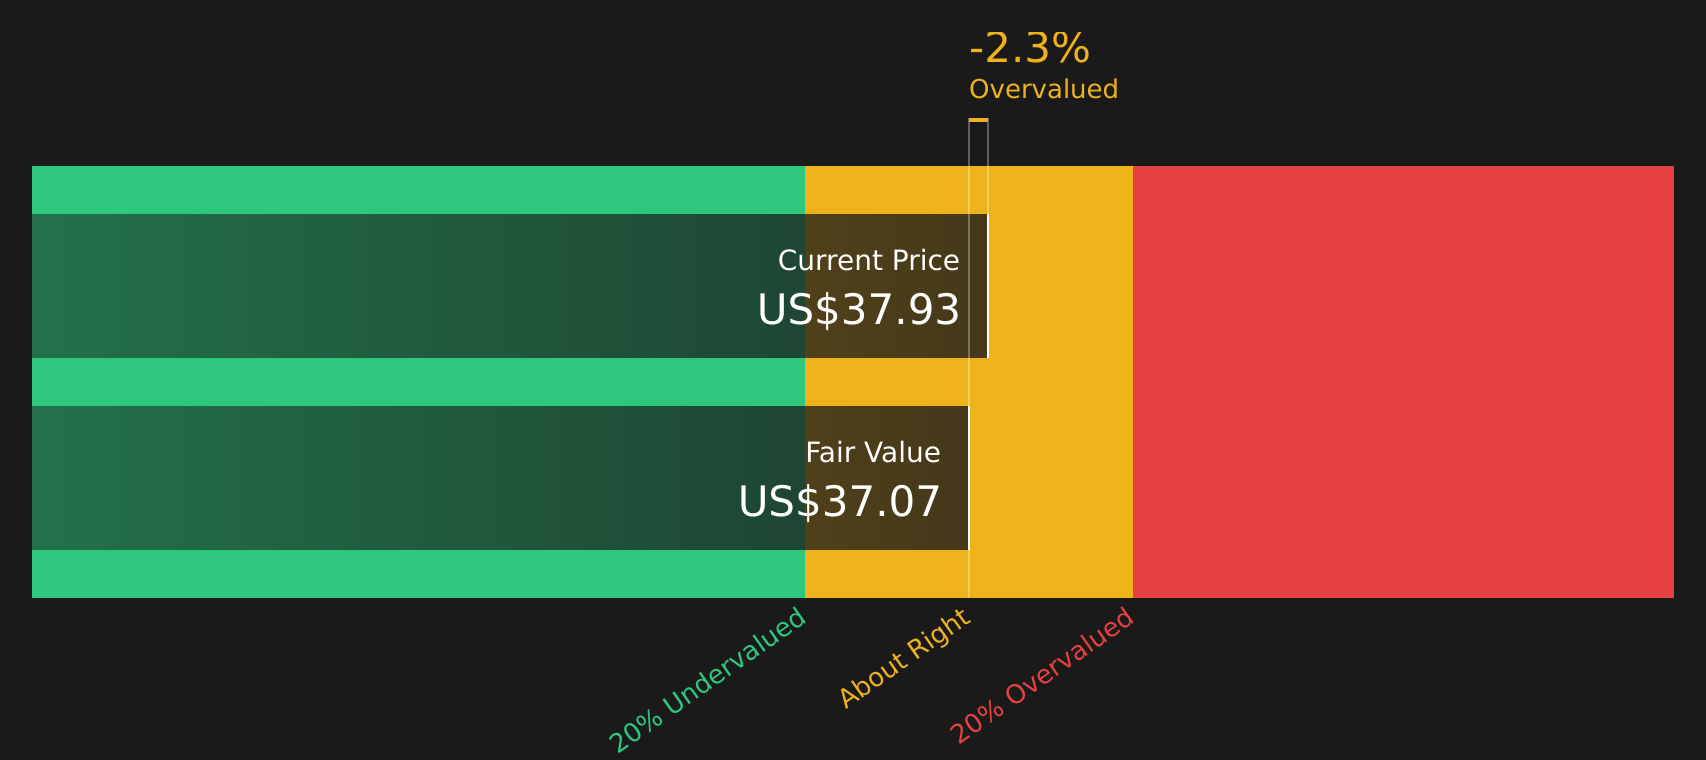
Running these inputs through the Excess Returns framework produces an intrinsic value of about $36.79 per share. This compares with a recent price of about $38.61, which is around 5.0% above the model estimate and points to a small degree of overvaluation.
Result: ABOUT RIGHT
AllianceBernstein Holding is fairly valued according to our Excess Returns, but this can change at a moment's notice. Track the value in your watchlist or portfolio and be alerted on when to act.
Approach 2: AllianceBernstein Holding Price vs Earnings
For a profitable company like AllianceBernstein Holding, the P/E ratio is a straightforward way to relate what you pay for each share to the earnings that support that price. It is a quick gauge of how the market is pricing those earnings today.
A higher or lower P/E often reflects what investors are baking in for future growth and how much risk they see in those earnings. Faster expected growth or lower perceived risk can justify a higher “normal” P/E, while slower growth or higher risk can support a lower multiple.
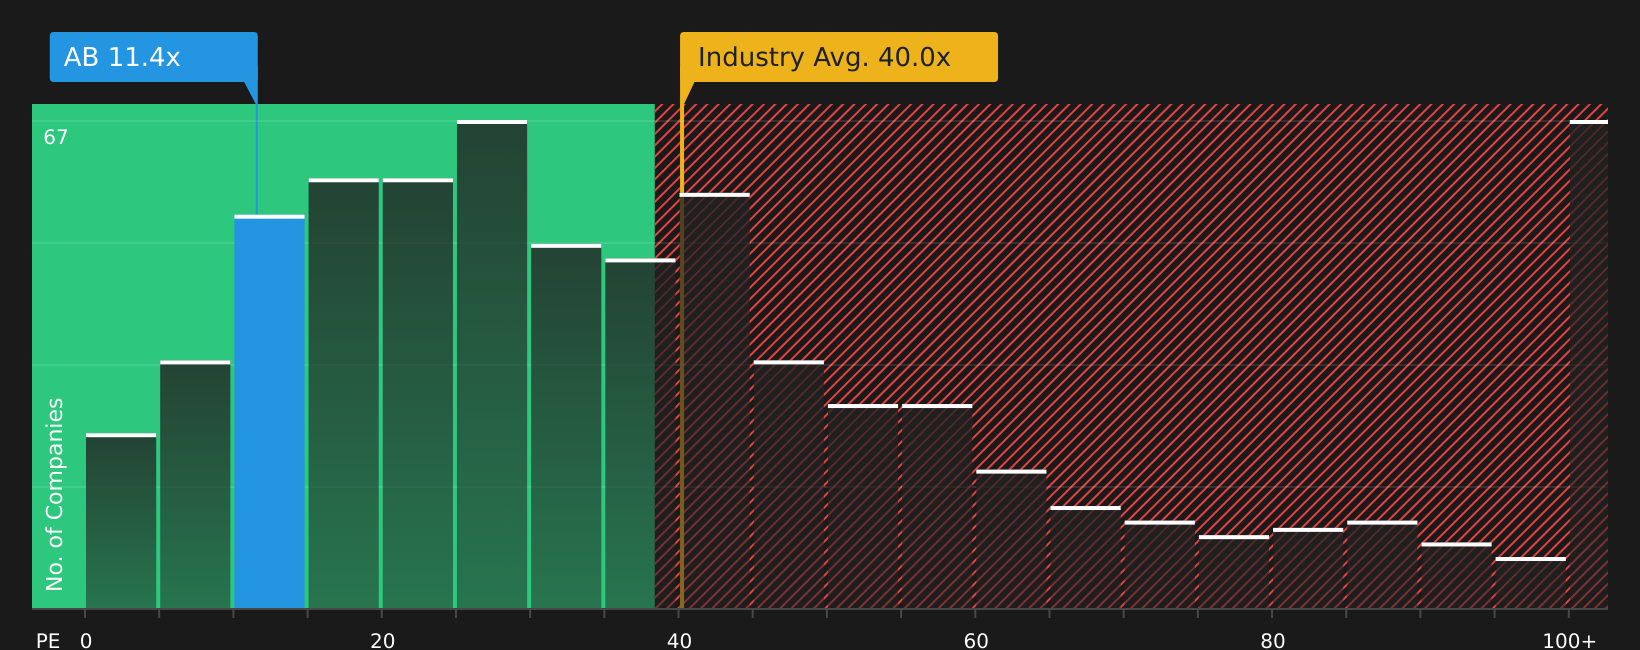
AllianceBernstein currently trades on a P/E of 11.59x. That sits below the peer average of 17.86x and well below the broader Capital Markets industry average of 41.11x. Simply Wall St’s Fair Ratio for AllianceBernstein is 8.29x, which is a proprietary estimate of what the P/E might be given factors such as earnings profile, industry, profit margins, market cap and risk characteristics. This tailored Fair Ratio can be more informative than raw comparisons with peers or the industry, because it adjusts for those company specific features rather than assuming all stocks deserve the same multiple. Set against the current 11.59x, the 8.29x Fair Ratio suggests the stock is trading at a richer level than that model implies.
Result: OVERVALUED
P/E ratios tell one story, but what if the real opportunity lies elsewhere? Start investing in legacies, not executives. Discover our 19 top founder-led companies.
Upgrade Your Decision Making: Choose your AllianceBernstein Holding Narrative
Earlier it was mentioned that there is an even better way to understand valuation. Narratives on Simply Wall St’s Community page let you attach a clear story about AllianceBernstein Holding to the numbers by linking your view on its expansion into high growth markets, private markets growth, fee pressure, distributions and buybacks to a set of revenue, earnings and margin assumptions. These then flow through to a Fair Value that you can compare with the current price to decide if the stock suits your own buy or sell criteria. Because Narratives are refreshed when new information such as analyst price targets, forecasts, distributions or repurchases are added, different investors can easily see how one Narrative might support a Fair Value close to the recent analyst consensus of about US$39.43, while another, more cautious view on margins or competition, supports a lower Fair Value. All of this happens within a simple framework that ties business story, forecast and valuation together.
Do you think there's more to the story for AllianceBernstein Holding? Head over to our Community to see what others are saying!

This article by Simply Wall St is general in nature. We provide commentary based on historical data and analyst forecasts only using an unbiased methodology and our articles are not intended to be financial advice. It does not constitute a recommendation to buy or sell any stock, and does not take account of your objectives, or your financial situation. We aim to bring you long-term focused analysis driven by fundamental data. Note that our analysis may not factor in the latest price-sensitive company announcements or qualitative material. Simply Wall St has no position in any stocks mentioned.
Have feedback on this article? Concerned about the content? Get in touch with us directly. Alternatively, email editorial-team@simplywallst.com