


- If you are wondering whether Polaris is priced attractively right now, it helps to step back from the headlines and look closely at what the current share price might already be factoring in.
- The stock last closed at US$60.15, with the share price up 56.2% over the past year but down 9.5% year to date, after a 7.1% decline over the last week and a 3.9% gain over the past month.
- Recent coverage has focused on how the stock's strong 1 year return sits alongside a weaker 3 year record, with the share price down 36.5% over that period and 45.7% over 5 years. This mix of long term weakness and more recent strength has kept attention on whether the current price is now closer to a recovery story or a re-rating that has already run its course.
- Polaris currently has a valuation score of 3 out of 6, and the sections that follow will walk through the main valuation approaches investors often check, before circling back to a broader framework that can help you interpret those numbers in a more complete way.
Approach 1: Polaris Discounted Cash Flow (DCF) Analysis
A Discounted Cash Flow, or DCF, model estimates what a stock could be worth by projecting its future cash flows and discounting them back to today’s value. It is essentially asking what all those future dollars are worth in today’s terms.
For Polaris, the model used is a 2 Stage Free Cash Flow to Equity approach, based on cash flow projections in $. The latest twelve month free cash flow is about $84.3 million. Analyst and extrapolated projections in the model run through 2035, with estimated free cash flow of $186.8 million in 2026 and $171.6 million in 2035, with intermediate years such as $143 million in 2028 and $166.1 million in 2034.
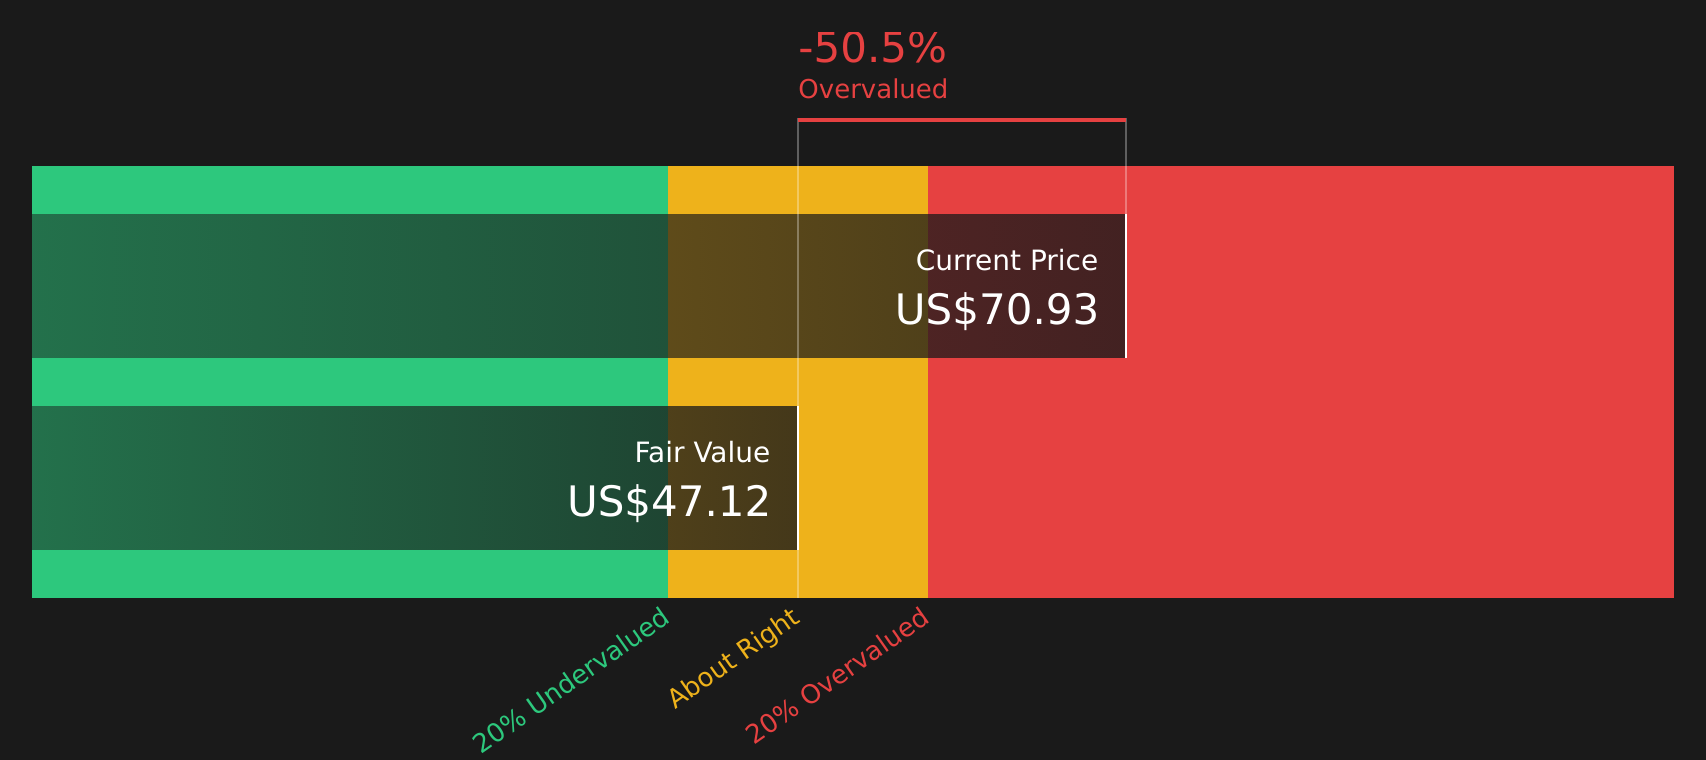
When all those projected cash flows are discounted back, the model arrives at an estimated intrinsic value of $47.22 per share, compared with the recent share price of $60.15. That implies the stock screens as about 27.4% overvalued on this DCF view.
Result: OVERVALUED
Our Discounted Cash Flow (DCF) analysis suggests Polaris may be overvalued by 27.4%. Discover 54 high quality undervalued stocks or create your own screener to find better value opportunities.
Approach 2: Polaris Price vs Sales
For companies that are established and generating meaningful revenue, the P/S ratio is a useful way to think about value, because it tells you how much you are paying for each dollar of sales, regardless of short term swings in profit.
What counts as a “normal” or “fair” P/S ratio tends to move with expectations for future growth and with perceived risk. Higher expected growth and lower perceived risk usually support a higher multiple, while slower growth or higher uncertainty often go with a lower multiple.
Polaris currently trades on a P/S ratio of 0.47x, compared with the Leisure industry average of 0.85x and a peer average of 1.07x. Simply Wall St’s Fair Ratio for Polaris is 0.60x, which reflects a proprietary assessment of factors such as earnings growth, profit margins, industry, market cap and specific risks.
This Fair Ratio can be more useful than a simple comparison with peers or the broad industry, because it adjusts the “expected” multiple to Polaris’ own profile rather than assuming it should match the group.
With a current P/S of 0.47x compared to a Fair Ratio of 0.60x, the stock screens as undervalued on this measure.
Result: UNDERVALUED

P/S ratios tell one story, but what if the real opportunity lies elsewhere? Start investing in legacies, not executives. Discover our 18 top founder-led companies.
Upgrade Your Decision Making: Choose your Polaris Narrative
Earlier it was mentioned that there is an even better way to understand valuation, so Narratives on Simply Wall St give you a clear story behind the numbers by linking your view of Polaris, including assumptions for future revenue, earnings and margins, to a financial forecast and a fair value that you can compare directly with the current share price. Each Narrative, such as the bullish fair value of US$81.00 or the more cautious view around US$45.33, sits inside the Community page and updates automatically when fresh news or earnings arrive, so you can quickly see whether your chosen fair value still supports buying, holding or selling at today’s price.
For Polaris however we will make it really easy for you with previews of two leading Polaris Narratives:
Fair value: US$68.33 per share
Implied discount vs last close: Polaris trades at about 11.9% below this fair value on this view
Revenue growth used in this narrative: 2.18% per year
- Analysts building this case are assuming modest revenue growth, improving profit margins and a P/E of 12.0x by 2029 to support a fair value close to US$68.
- The thesis leans on margin support from tariff mitigation efforts, premium product demand and new product launches across powersports and marine.
- Key watchpoints are tariff costs, choppy demand, international revenue pressure and the risk that earnings fall short of the consensus path implied in the model.
Fair value: US$45.33 per share
Implied premium vs last close: Polaris trades at about 32.8% above this fair value on this more cautious view
Revenue growth used in this narrative: 2.16% per year
- This narrative uses similar top line growth to consensus but factors in weaker margins and a lower P/E of 11.4x by 2029 to arrive at a fair value around US$45.
- It highlights pressure from electrification, demographics, tariffs and promotional activity, which together could keep earnings power below what the current share price suggests.
- The case would be challenged if Polaris continues to gain share, executes on its product pipeline and keeps improving efficiency and cash generation more than the cautious scenario allows for.
If you want to keep tracking how these assumptions evolve, you can see how fair value, risks and sentiment shift in real time inside the wider range of community views for Polaris, including both bullish and cautious takes, plus neutral cases in between.
To see how these results tie into long-term growth, risks, and valuation, check out the full range of community narratives for Polaris on Simply Wall St. Add the company to your watchlist or portfolio so you'll be alerted when the story evolves.
Do you think there's more to the story for Polaris? Head over to our Community to see what others are saying!

This article by Simply Wall St is general in nature. We provide commentary based on historical data and analyst forecasts only using an unbiased methodology and our articles are not intended to be financial advice. It does not constitute a recommendation to buy or sell any stock, and does not take account of your objectives, or your financial situation. We aim to bring you long-term focused analysis driven by fundamental data. Note that our analysis may not factor in the latest price-sensitive company announcements or qualitative material. Simply Wall St has no position in any stocks mentioned.
Have feedback on this article? Concerned about the content? Get in touch with us directly. Alternatively, email editorial-team@simplywallst.com