


Earnings and recent performance context
NOV (NOV) has attracted investor attention after recent results showed revenue of US$8,693.0m and net income of US$91.0m, along with a last close of US$20.96 and a year-to-date total return of 27.7%.
See our latest analysis for NOV.
The stock has gained 9.7% on a 1 month share price basis and 27.7% year to date, while the 1 year total shareholder return of 73.7% points to momentum that investors are closely watching in relation to current earnings and valuation.
If NOV’s recent move has you thinking about where capital might work harder, this could be a good moment to scan 35 power grid technology and infrastructure stocks
With NOV trading near its US$21.20 analyst price target yet carrying an estimated 25.8% intrinsic discount, the key question is whether the stock still offers upside potential or whether the market is already pricing in future growth.
Most Popular Narrative: 1.5% Overvalued
Analysts’ most followed narrative pegs NOV’s fair value at $20.65, slightly below the last close at $20.96. This suggests a tight valuation gap built on long cycle energy assumptions.
Sustained investment in energy infrastructure, including LNG and gas processing driven by global energy security needs and rising energy demand in developing markets, supports long-term growth in NOV's composite pipe, process systems, and related offerings, enhancing recurring and project-based revenues. (Revenue)
Want to see what revenue path and margin rebuild sit behind that fair value tag? The narrative leans on gradual top line expansion and a different earnings mix than today. Curious how those ingredients combine into a single discounted cash flow story using a 7.58% rate?
Result: Fair Value of $20.65 (OVERVALUED)
Have a read of the narrative in full and understand what's behind the forecasts.
However, ongoing tariff and inflation pressures, along with uneven offshore orders and project delays, could quickly challenge the fair value narrative that analysts are using.
Find out about the key risks to this NOV narrative.
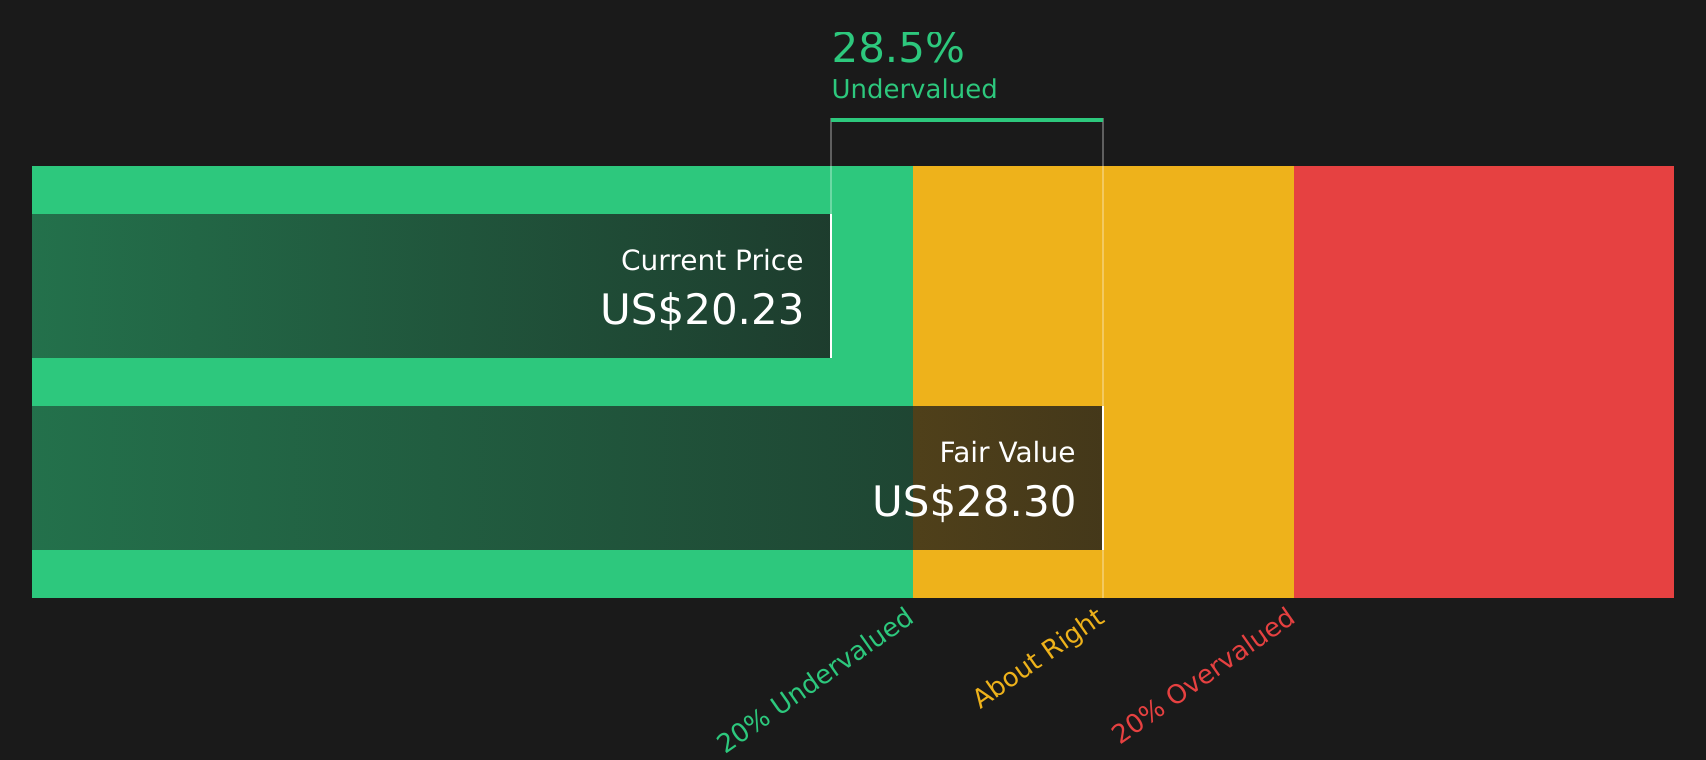
Another View: Cash Flows Point to Undervaluation
While analyst narratives cluster around a fair value of $20.65 and tag NOV as 1.5% overvalued, the Simply Wall St DCF model tells a different story. With an intrinsic value estimate of $28.23 per share, NOV screens as 25.8% undervalued and raises the question of which set of assumptions you trust more.
Look into how the SWS DCF model arrives at its fair value.
Simply Wall St performs a discounted cash flow (DCF) on every stock in the world every day (check out NOV for example). We show the entire calculation in full. You can track the result in your watchlist or portfolio and be alerted when this changes, or use our stock screener to discover 54 high quality undervalued stocks. If you save a screener we even alert you when new companies match - so you never miss a potential opportunity.
Next Steps
With mixed signals on value and sentiment, this is a moment to look under the hood yourself and act while the data is fresh, starting with the 2 key rewards and 3 important warning signs.
Looking for more investment ideas?
If NOV has your attention, do not stop here. Broaden your watchlist with stocks that match different goals so you are not missing other useful opportunities.
- Target potential mispricings by scanning companies that combine quality and value through the 54 high quality undervalued stocks.
- Build a watchlist of income candidates by checking out resilient payers in the 12 dividend fortresses.
- Prioritise stability by reviewing companies that score well for financial resilience via the 66 resilient stocks with low risk scores.
This article by Simply Wall St is general in nature. We provide commentary based on historical data and analyst forecasts only using an unbiased methodology and our articles are not intended to be financial advice. It does not constitute a recommendation to buy or sell any stock, and does not take account of your objectives, or your financial situation. We aim to bring you long-term focused analysis driven by fundamental data. Note that our analysis may not factor in the latest price-sensitive company announcements or qualitative material. Simply Wall St has no position in any stocks mentioned.
Have feedback on this article? Concerned about the content? Get in touch with us directly. Alternatively, email editorial-team@simplywallst.com