

Key Things to Know About Volatility as Earnings Season Begins

Stock prices may see larger-than-normal moves during earnings season. For investors looking to trade against these moves in the options market, it’s helpful to understand the possible shifts in implied volatility (IV) that come along with earnings season.
Increased IV Before the Earnings Report
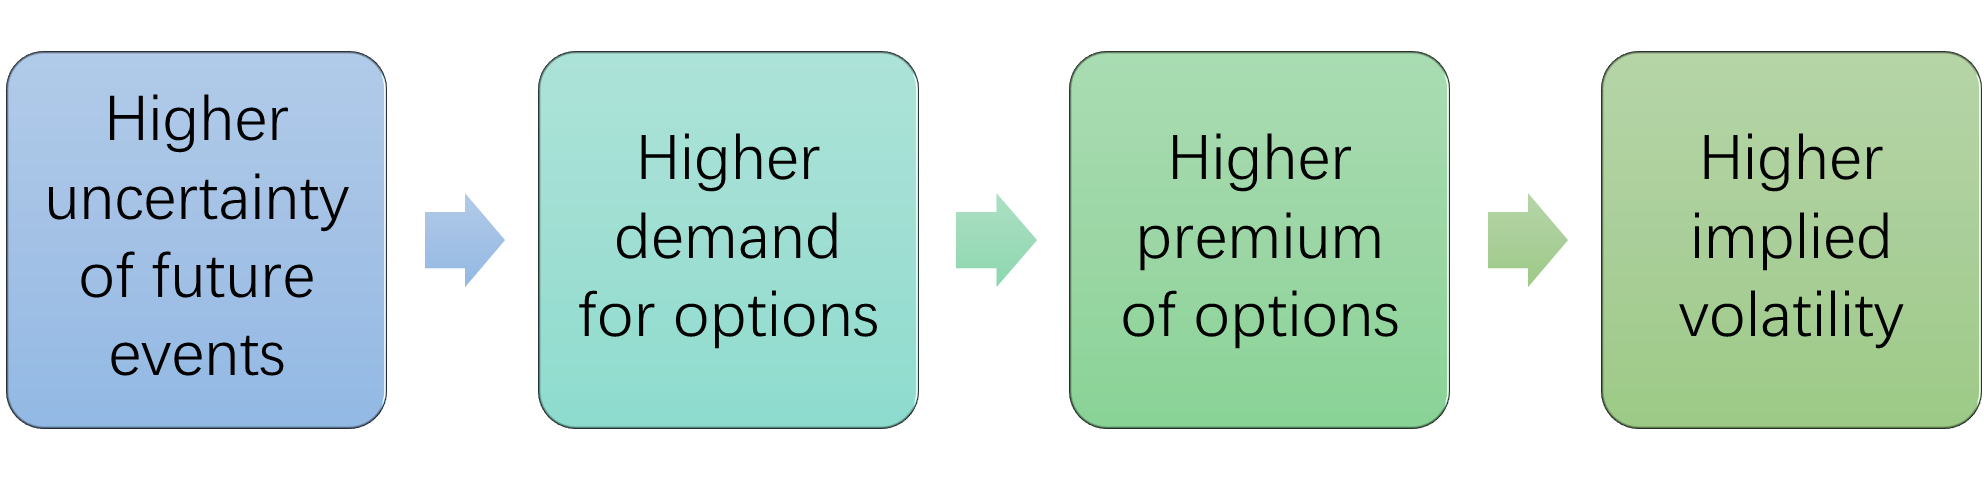
Like any other investment instrument or asset, the price, or the premium, of each option contract is decided through the dynamics of supply and demand. Higher demand relative to supply will lead to higher prices in options, with an upsurging IV. Conversely, lower demand relative to supply will result in lower options prices and a downward surge in IV.
Before an earnings release, investors and traders often use implied volatility to help gauge market expectations and make trading decisions. In most cases, implied volatility tends to rise before an earnings release as uncertainty increases and traders begin to position themselves in anticipation of the release. Increased demand for options contracts resulting from this anticipation can drive up their prices, which in turn can cause implied volatility to rise.
For example, if an investor expects the earnings report to be disappointing and generate a downside movement, he may buy puts before earnings reports are released in order to protect his portfolio against potential losses. Speculative traders may also participate in buying puts when holding a bearish outlook. Demand for options from both hedgers and speculators drives up the implied volatility during earnings season.
IV Crush After Company Earnings are Released
Generally, after an earnings release, the level of implied volatility decreases as the uncertainty subsides and the market reacts to the actual results. A swift reduction in implied volatility is known as an implied volatility crush (IV crush), which triggers a similarly steep decline in an option's value.
A volatility crush can be beneficial for option sellers, since it can lead to the prices of options they sold declining, allowing them to buy them back and lock in a gain. Conversely, it can be detrimental for option buyers, as it can cause the value of their options to decrease. In some cases, options buyers can suffer severe losses even if they are right about price movements.

This $Apple Inc (AAPL) chart shows quarterly reports and implied volatility. Notice how the IV declines after earnings are released.
Given this recurring pattern of IV crushes, option buyers often keep a close eye on implied volatility levels before entering a trade. Of course, even a reliable pattern can be broken, and nothing is certain about future events. In any case, IV is only one among many factors in option pricing. You must consider the entire market environment to make a truly informed decision.
How to Examine Current Levels of Implied Volatility
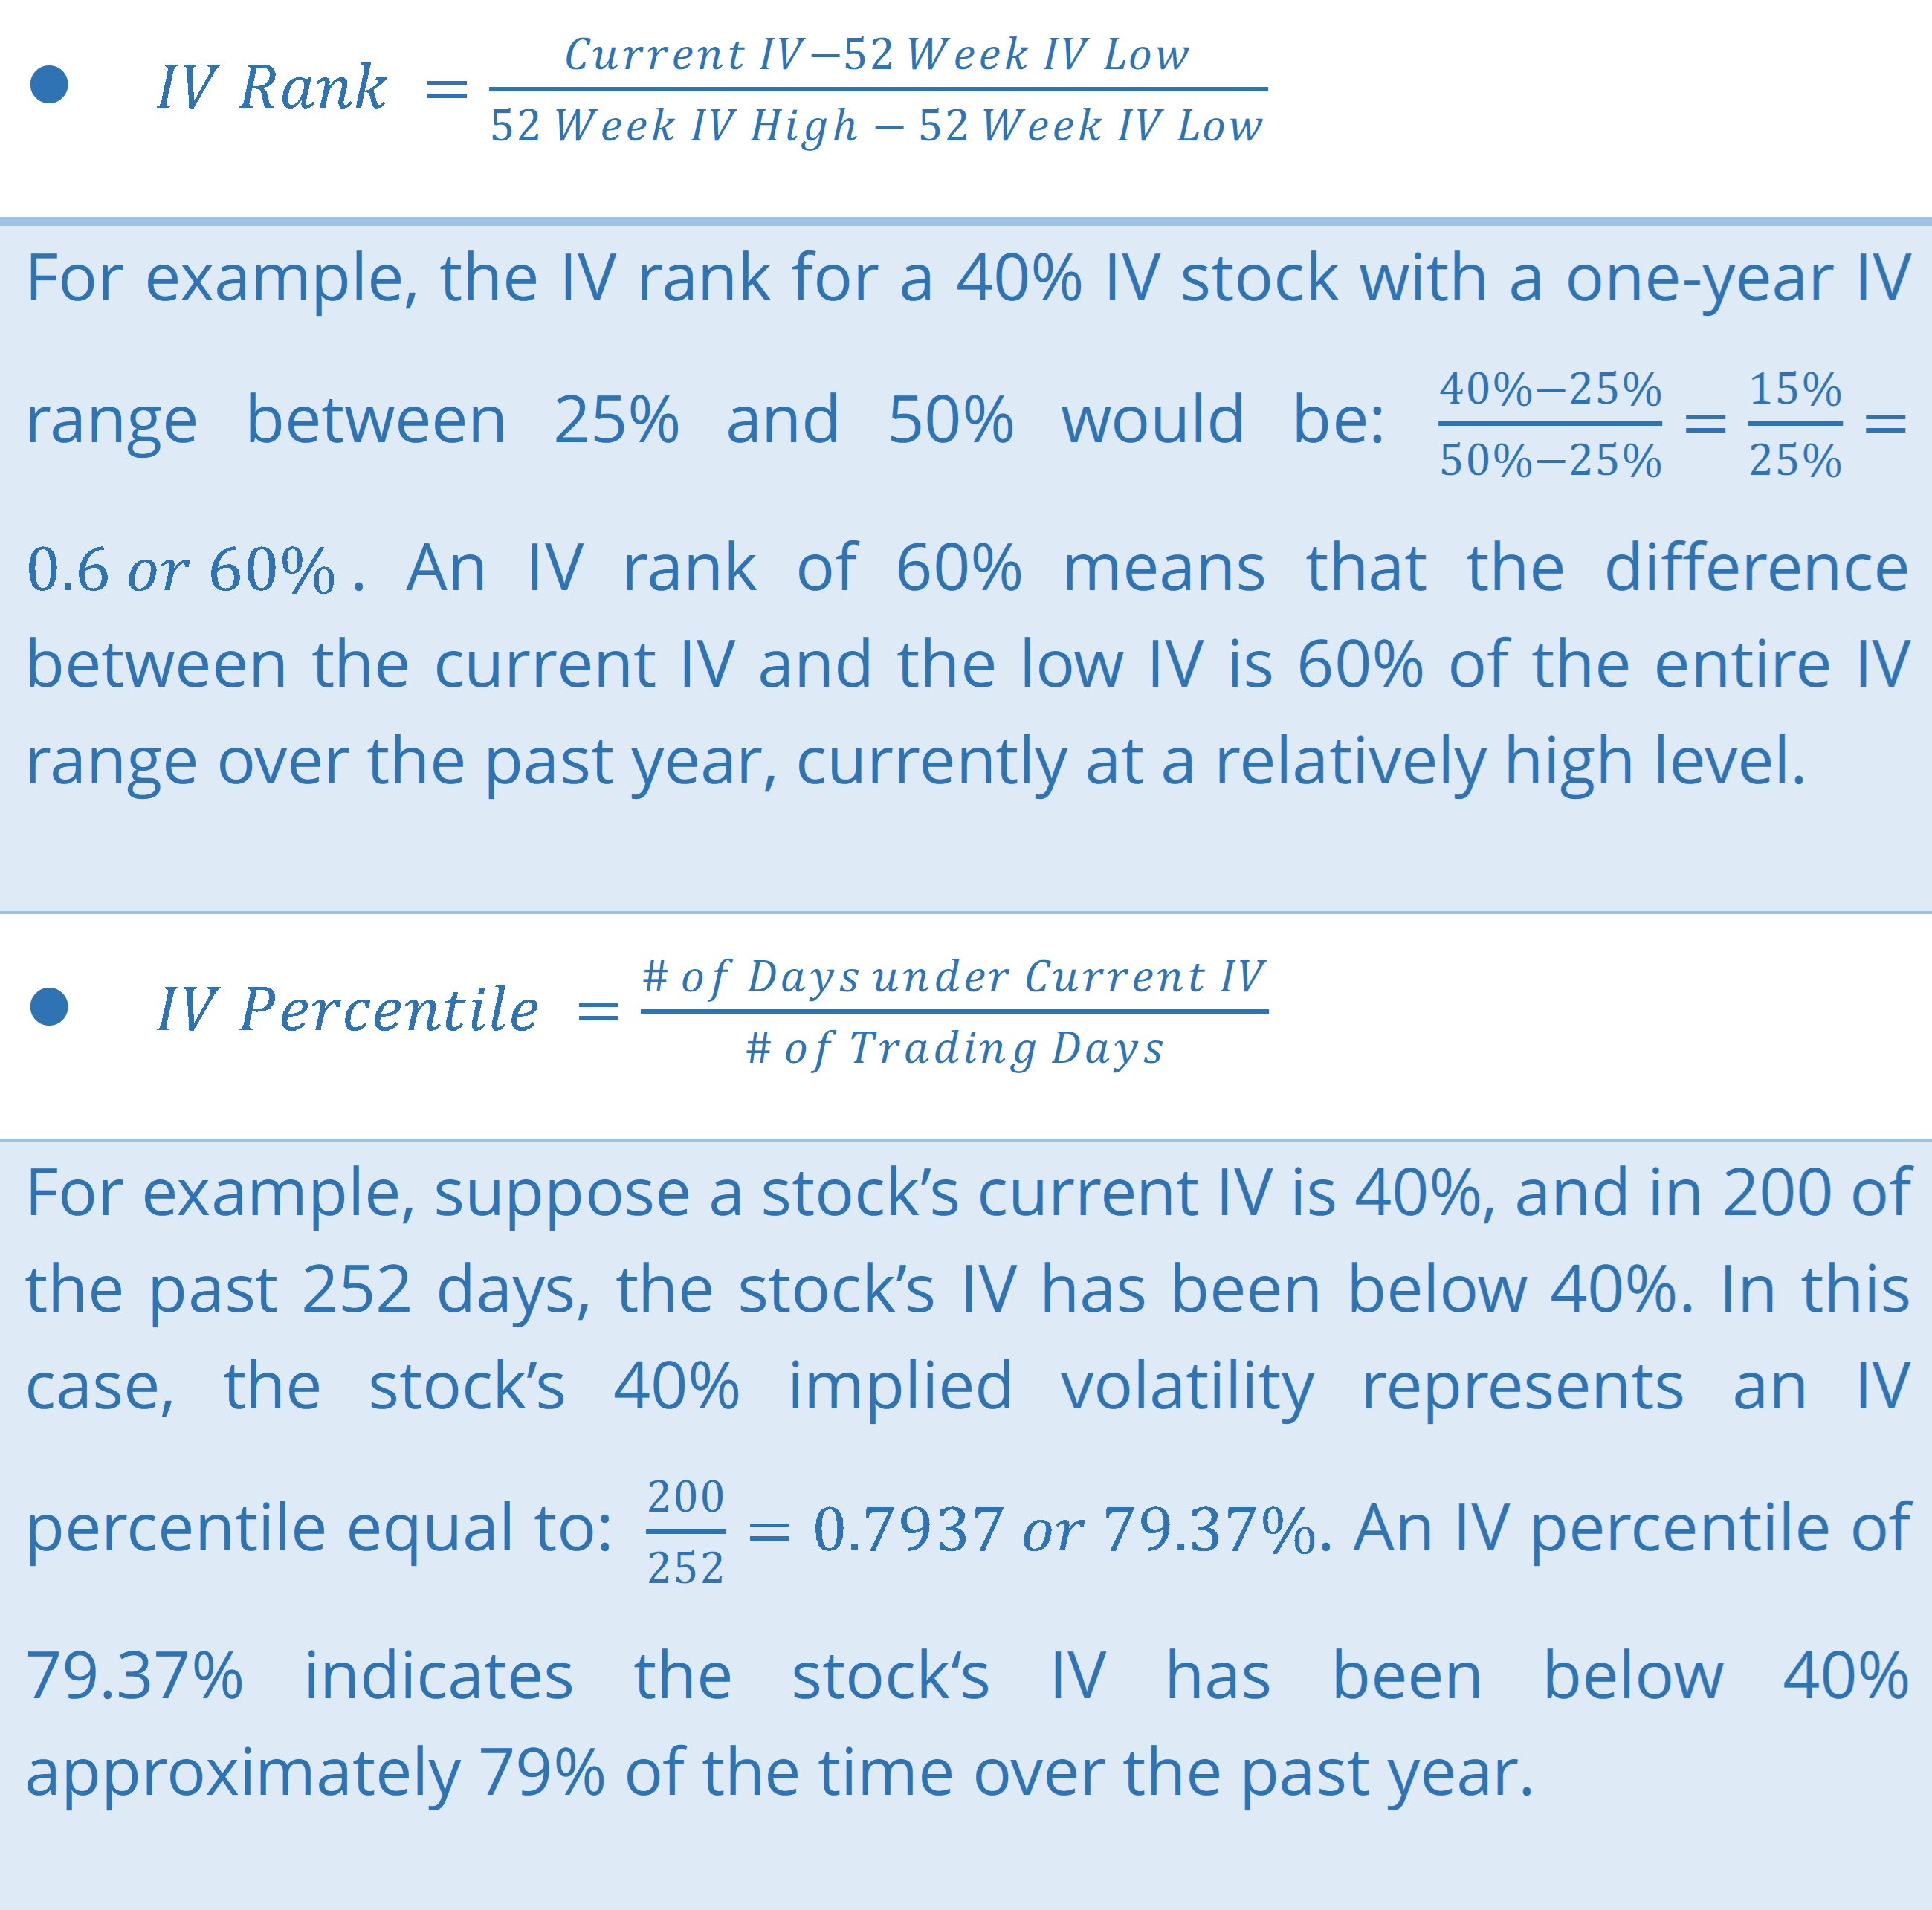
The absolute number of IV alone doesn't tell you whether it is currently high or low. For example, if the IV on a symbol has ranged from 80% to 200% in the last year, a current IV number of 80% would be very low. However, if the stock had an IV range of 10% to 40%, then an IV of 40% would be very high.
To read current levels of implied volatility, it is important to understand IV rank and IV percentile, two concepts that add the annual range to gauge a stock's current vs. historical levels of implied volatility.
Summary
Implied volatility can change dramatically before and after earnings announcements, significantly impacting options trading. Options traders should gather information about changing volatility levels, and use that information to help them make informed trading decisions.

All Comments