


Twin Disc (TWIN) has just posted a sharp swing higher in profitability for Q2 2026, with revenue of US$90.2 million and basic EPS of US$1.58 off net income of US$22.4 million, setting a very different tone from recent quarters. Over the last few periods, the company has seen quarterly revenue move between US$72.9 million and US$96.7 million, while basic EPS has ranged from a loss of US$0.20 per share to a gain of US$1.58, giving investors a wide band of earnings outcomes to weigh against an improving margin story.
See our full analysis for Twin Disc.With the latest numbers on the table, the next step is to see how this profit profile lines up with the prevailing narratives around Twin Disc, and where those stories might need an update.
Curious how numbers become stories that shape markets? Explore Community Narratives
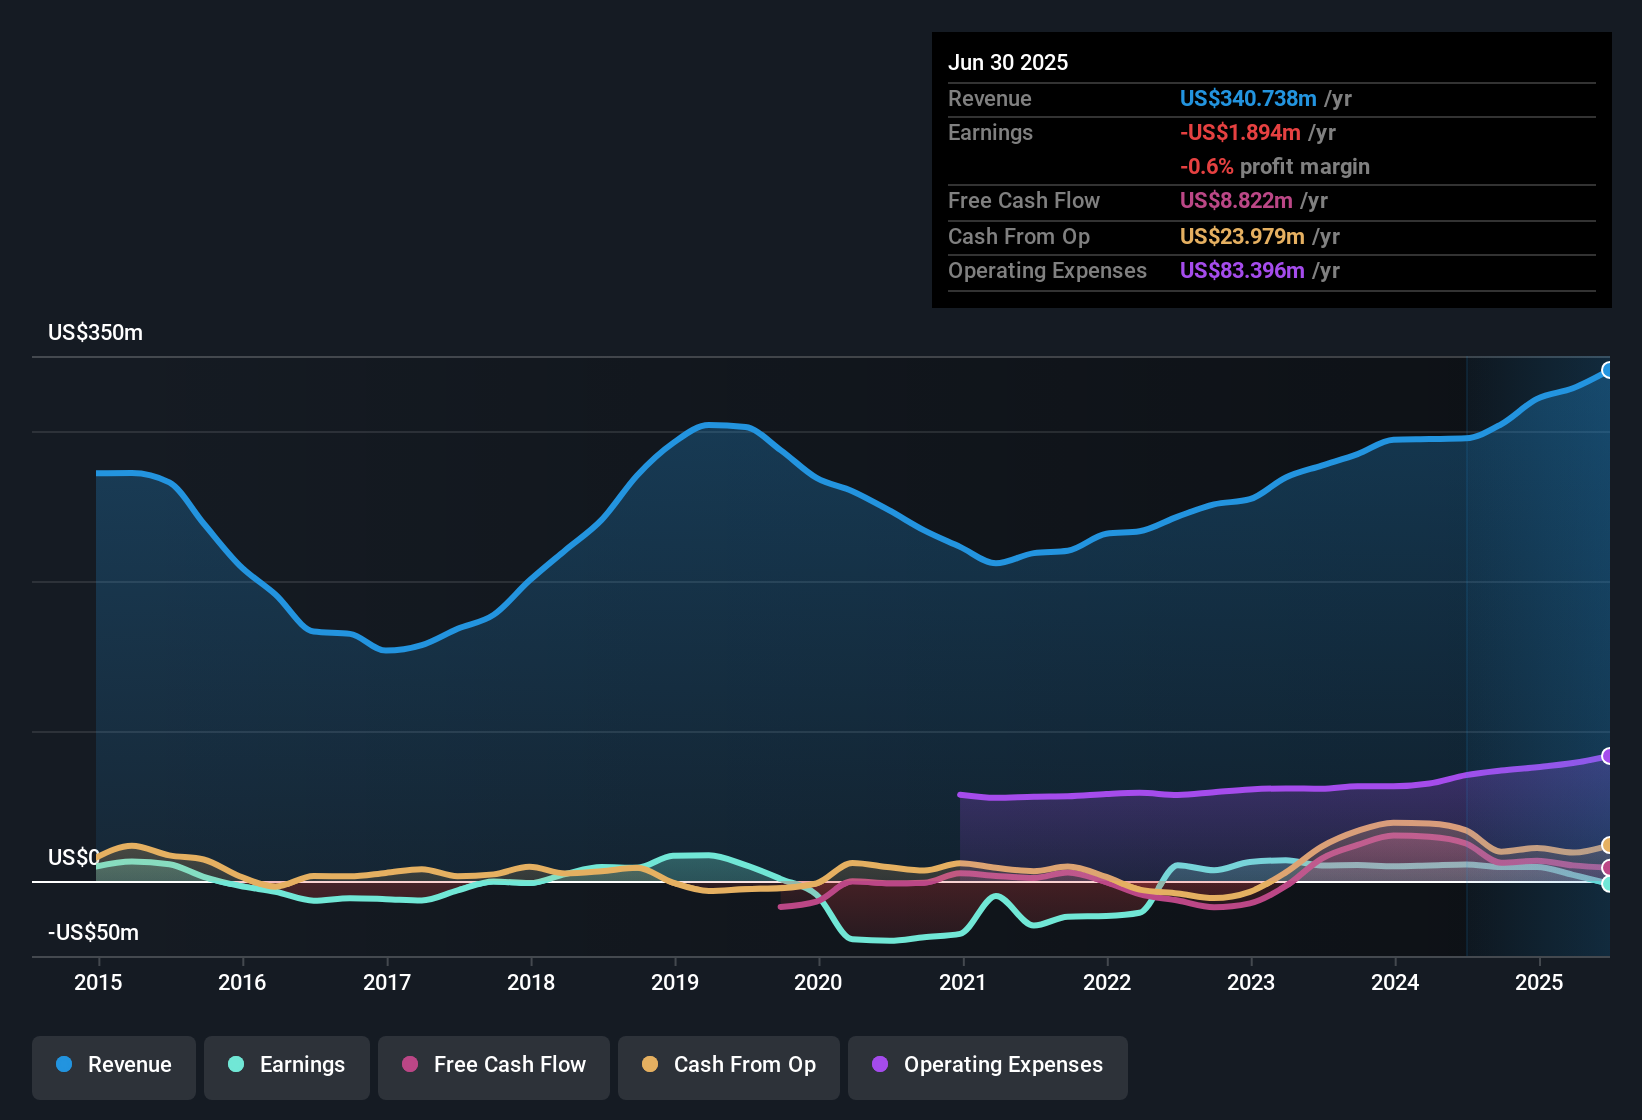
132% earnings growth and 6.3% margin on trailing basis
- Over the last 12 months, Twin Disc reported earnings growth of 132.3% with net income of US$21.8 million on US$348.1 million of revenue, giving a trailing net margin of 6.3% versus 2.9% in the prior trailing window.
- What stands out for the more bullish take is that this trailing margin and earnings profile is backed by several quarters of profitability in the data. However, the latest single quarter still shows how lumpy results can be:
- On a quarterly view, net income swings from a loss of US$2.8 million in Q1 2025 to a profit of US$22.4 million in Q2 2026, even though revenue stays in a relatively tight US$72.9 million to US$96.7 million band.
- This combination of a 6.3% trailing margin, 132.3% earnings growth and uneven quarter to quarter profit suggests bulls will likely focus on the 12 month trend, while also needing to keep an eye on how often losses still appear in the history.
P/E of 10.6x versus US$16.14 price
- Twin Disc is trading on a trailing P/E of 10.6x at a share price of US$16.14, compared with a cited US market average P/E of 19.3x, a US Machinery industry average P/E of 28.2x and a peer group average P/E of 7.7x.
- Critics highlight that, despite the P/E sitting below the wider market and industry, some of the valuation checks in the data look more cautious when put next to earnings forecasts:
- A DCF fair value of about US$0.89 per share is far below the current US$16.14 price, which heavily challenges a simple value argument built only on the P/E comparison.
- Analyst models in the dataset point to earnings declining by about 3.6% per year over the next three years, which means bears can point to both the DCF fair value and the modeled earnings path when questioning how much support the current multiple really has.
Revenue at US$348.1 million on trailing basis
- On a trailing 12 month view to Q2 2026, Twin Disc booked US$348.1 million of revenue, with commentary in the analysis describing this as about 9.6% annual growth versus a referenced US market figure of 10.1% a year.
- Supporters of the more cautious narrative point out that even with this revenue performance, the risk section of the data still flags pressure on forward profit expectations:
- The same dataset that shows 9.6% trailing revenue growth and a move to a 6.3% net margin also notes that analysts are modeling revenue and earnings to decline, so the recent revenue level and margin do not automatically carry through into future periods in those forecasts.
- For an investor, that contrast between a relatively solid trailing revenue base and the projected declines means it is worth checking how sensitive the business has been to swings in demand in earlier quarters where net income ranged between a loss of US$2.8 million and a profit of US$22.4 million.
Next Steps
Don't just look at this quarter; the real story is in the long-term trend. We've done an in-depth analysis on Twin Disc's growth and its valuation to see if today's price is a bargain. Add the company to your watchlist or portfolio now so you don't miss the next big move.
See What Else Is Out There
Twin Disc’s earnings picture includes swings between quarterly losses and strong profits, combined with forecasts that model both revenue and earnings declines despite the current trailing margin.
If those ups and downs leave you wanting companies with clearer value support, use our these 868 undervalued stocks based on cash flows today to focus on ideas where pricing and fundamentals look more closely aligned.
This article by Simply Wall St is general in nature. We provide commentary based on historical data and analyst forecasts only using an unbiased methodology and our articles are not intended to be financial advice. It does not constitute a recommendation to buy or sell any stock, and does not take account of your objectives, or your financial situation. We aim to bring you long-term focused analysis driven by fundamental data. Note that our analysis may not factor in the latest price-sensitive company announcements or qualitative material. Simply Wall St has no position in any stocks mentioned.
Have feedback on this article? Concerned about the content? Get in touch with us directly. Alternatively, email editorial-team@simplywallst.com