


- Wondering if Olaplex Holdings at US$2.04 is a bargain or a value trap? This breakdown will help you size up what the current share price might be reflecting.
- The stock has posted returns of 0.5% over the last 7 days, 64.5% over the last 30 days, 51.1% year to date, 67.2% over the last year, and a 46.6% decline over 3 years, which signals that sentiment around the shares has shifted more than once.
- Recent headlines have focused on how traders are reacting to the sharp 30 day and 1 year returns, with some commentators questioning whether the valuation now bakes in too much optimism after such a strong run. Others point to the longer term 3 year decline as a reminder that the story has not been straightforward for investors.
- Right now Olaplex scores just 1 out of 6 on Simply Wall St's valuation checks. The next sections will break down what that means across different valuation methods and hint at a fuller way to think about value that goes beyond a single score.
Olaplex Holdings scores just 1/6 on our valuation checks. See what other red flags we found in the full valuation breakdown.
Approach 1: Olaplex Holdings Discounted Cash Flow (DCF) Analysis
A Discounted Cash Flow, or DCF, model estimates what a business might be worth today by projecting its future cash flows and then discounting those back to a present value.
For Olaplex Holdings, the model used is a 2 Stage Free Cash Flow to Equity approach. The latest twelve month free cash flow is about $55.3 million. Analysts provide explicit estimates up to 2027, where free cash flow is projected at $104.7 million, and Simply Wall St extends this with additional projections out to 2035 using a set of gradual adjustments each year.
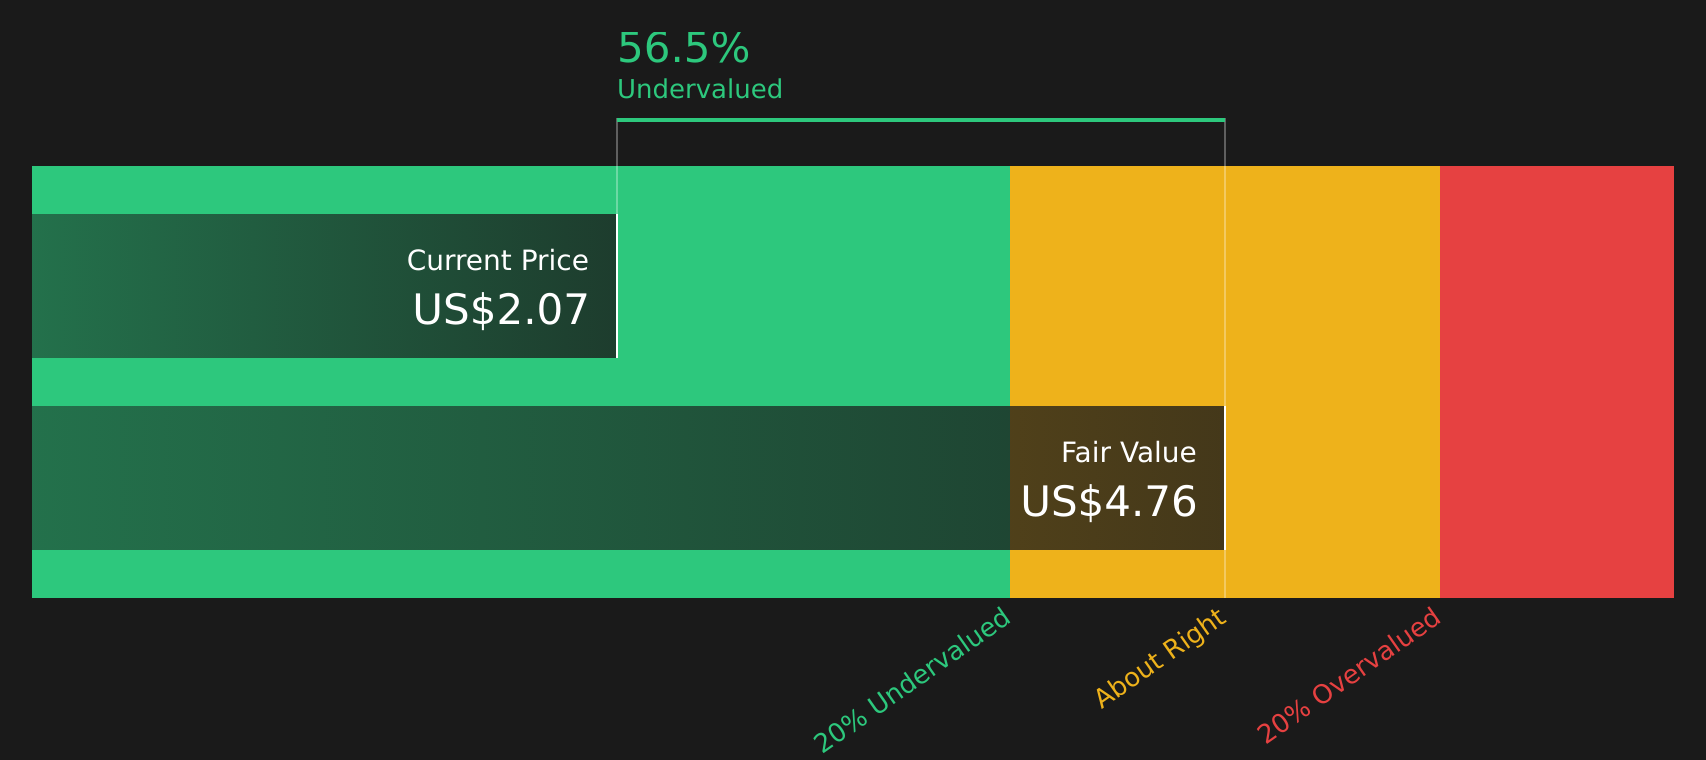
These projected cash flows, all in $, are discounted and combined to arrive at an estimated intrinsic value of about $2.50 per share. Compared with the recent share price of around $2.04, the DCF output suggests the stock trades at an 18.5% discount, which points to potential undervaluation on this model.
Result: UNDERVALUED
Our Discounted Cash Flow (DCF) analysis suggests Olaplex Holdings is undervalued by 18.5%. Track this in your watchlist or portfolio, or discover 59 more high quality undervalued stocks.
Approach 2: Olaplex Holdings Price vs Sales
For companies where earnings are not a clean guide, the P/S ratio can be a useful way to think about value because it compares the share price to the revenue the business is already generating. Investors typically look for a P/S that lines up with what they expect in terms of growth and risk, with faster, more resilient growth often supporting a higher multiple than slower or more uncertain growth.
Olaplex currently trades on a P/S of 3.24x, compared with the Personal Products industry average of 0.88x and a peer average of 0.49x. Simply Wall St also calculates a proprietary “Fair Ratio” for P/S of 0.95x for Olaplex, based on factors such as its growth profile, industry, profit margins, market cap and specific risks.
This Fair Ratio can be more informative than a straight comparison with peers or the industry, because it adjusts for the company’s own characteristics rather than assuming that one size fits all. Compared with this 0.95x Fair Ratio, the current 3.24x P/S suggests that the shares are pricing in more than the model implies.
Result: OVERVALUED

P/S ratios tell one story, but what if the real opportunity lies elsewhere? Start investing in legacies, not executives. Discover our 19 top founder-led companies.
Upgrade Your Decision Making: Choose your Olaplex Holdings Narrative
Earlier it was mentioned that there is an even better way to understand valuation, so Narratives are introduced as a simple way for you to connect your view of Olaplex Holdings with a set of revenue, earnings and margin assumptions, and translate that into a Fair Value you can compare to the current share price.
On Simply Wall St's Community page, Narratives let you pick or create a story that fits how you see Olaplex, link that story to a financial forecast, and then see a Fair Value estimate that updates when new information such as earnings releases, deal news or guidance arrives.
For example, one Olaplex Narrative might lean toward the more cautious view, closer to a Fair Value of about US$1.41. Another might reflect a more optimistic stance closer to US$3.59. By comparing those Fair Values with the current price you can decide whether the stock looks expensive, cheap or roughly in line with your own expectations.
For Olaplex Holdings however, we will make it really easy for you with previews of two leading Olaplex Holdings Narratives:
Fair Value: US$3.59 per share
Implied discount to this Fair Value at US$2.04: about 43%
Revenue growth assumption: 3.52%
- Assumes Henkel takeover interest, a richer product pipeline, and a more refined earnings profile could support a higher long term valuation.
- Builds in modest revenue growth with higher profit margins and a lower discount rate, paired with a solid net margin profile and a future P/E of 21.08x.
- Leans on the view that updated Street work from larger brokers and stronger self care trends can support a Fair Value that sits well above recent trading levels.
Fair Value: US$1.85 per share
Implied premium to this Fair Value at US$2.04: about 10%
Revenue growth assumption: 1.36%
- Anchors on the analyst consensus target that bakes in modest revenue growth, rising margins and a future P/E of 26.68x, but keeps expectations in check.
- Highlights ongoing pressure in specialty retail, thinner EBITDA margins and execution risk around Olaplex's transformation plans as key watchpoints.
- Frames US$1.85 as a central case that already reflects both takeover headlines and margin resilience, with upside and downside linked to how sales and earnings progress from here.
Both Narratives are built from the same core data, but they tell very different stories about what needs to happen on revenue, margins and valuation for Olaplex to justify each Fair Value. To see how these scenarios line up with your own view on the brand, its channels and the reported takeover talks, you can step through the full set of Community Narratives and decide which assumptions feel closest to your own.To see how these results tie into long-term growth, risks, and valuation, check out the full range of community narratives for Olaplex Holdings on Simply Wall St. Add the company to your watchlist or portfolio so you'll be alerted when the story evolves.
Do you think there's more to the story for Olaplex Holdings? Head over to our Community to see what others are saying!

This article by Simply Wall St is general in nature. We provide commentary based on historical data and analyst forecasts only using an unbiased methodology and our articles are not intended to be financial advice. It does not constitute a recommendation to buy or sell any stock, and does not take account of your objectives, or your financial situation. We aim to bring you long-term focused analysis driven by fundamental data. Note that our analysis may not factor in the latest price-sensitive company announcements or qualitative material. Simply Wall St has no position in any stocks mentioned.
Have feedback on this article? Concerned about the content? Get in touch with us directly. Alternatively, email editorial-team@simplywallst.com