


The market has climbed 4.0% in the last 7 days and 39% over the past year, with earnings forecast to grow by 16% annually. Though often considered outdated, penny stocks still hold potential when supported by robust financials, offering opportunities that larger firms might overlook. We'll explore several penny stocks that stand out for their financial strength and potential for growth, appealing to investors looking for under-the-radar opportunities.
Top 10 Penny Stocks In The United States
| Name | Share Price | Market Cap | Rewards & Risks |
| WM Technology (MAPS) | $0.35 | $60.5M | ✅ 3 ⚠️ 5 View Analysis > |
| LexinFintech Holdings (LX) | $2.35 | $395.42M | ✅ 3 ⚠️ 2 View Analysis > |
| FinVolution Group (FINV) | $4.80 | $1.21B | ✅ 4 ⚠️ 1 View Analysis > |
| Tuniu (TOUR) | $0.722 | $83.77M | ✅ 2 ⚠️ 2 View Analysis > |
| Information Services Group (III) | $3.11 | $204.05M | ✅ 3 ⚠️ 1 View Analysis > |
| Golden Growers Cooperative (GGRO.U) | $5.00 | $77.45M | ✅ 2 ⚠️ 5 View Analysis > |
| Niagen Bioscience (NAGE) | $4.84 | $388.4M | ✅ 3 ⚠️ 1 View Analysis > |
| LifeVantage (LFVN) | $4.78 | $61.21M | ✅ 4 ⚠️ 3 View Analysis > |
| SIGA Technologies (SIGA) | $7.80 | $341.03M | ✅ 2 ⚠️ 1 View Analysis > |
| Marine Petroleum Trust (MARP.S) | $4.71 | $9.42M | ✅ 2 ⚠️ 4 View Analysis > |
Click here to see the full list of 345 stocks from our US Penny Stocks screener.
Here's a peek at a few of the choices from the screener.
SIGA Technologies (SIGA)
Simply Wall St Financial Health Rating: ★★★★★★
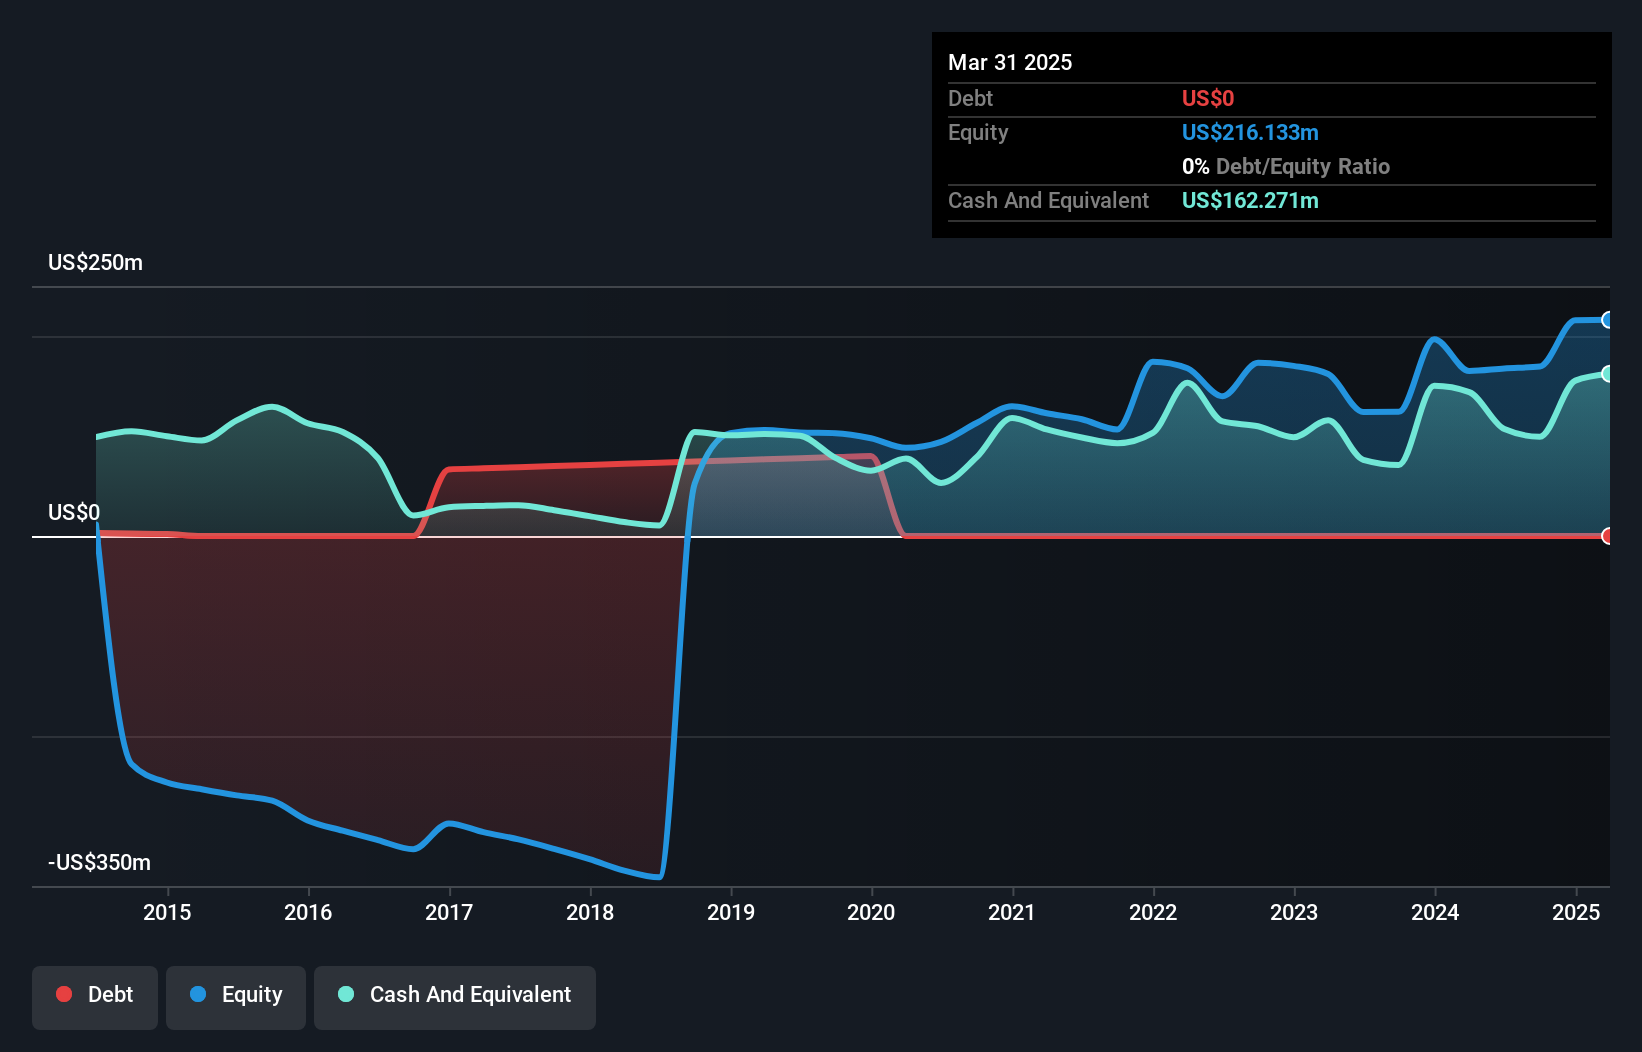
Overview: SIGA Technologies, Inc. is a commercial-stage pharmaceutical company specializing in the health security market in the United States, with a market cap of $341.03 million.
Operations: The company's revenue is primarily generated from its Pharmaceuticals segment, totaling $94.57 million.
Market Cap: $341.03M
SIGA Technologies, Inc. presents a mixed picture for investors interested in penny stocks. The company is debt-free and maintains strong liquidity, with short-term assets of US$212.9 million covering both short and long-term liabilities comfortably. However, SIGA's recent financial performance shows challenges; revenue for 2025 was US$94.57 million, down from the previous year, with net income also declining significantly to US$23.28 million from US$59.21 million in 2024. Despite this downturn, earnings are forecasted to grow substantially at over 91% annually moving forward, suggesting potential recovery prospects ahead.
- Get an in-depth perspective on SIGA Technologies' performance by reading our balance sheet health report here.
- Explore SIGA Technologies' analyst forecasts in our growth report.
Apartment Investment and Management (AIV)
Simply Wall St Financial Health Rating: ★★★★☆☆
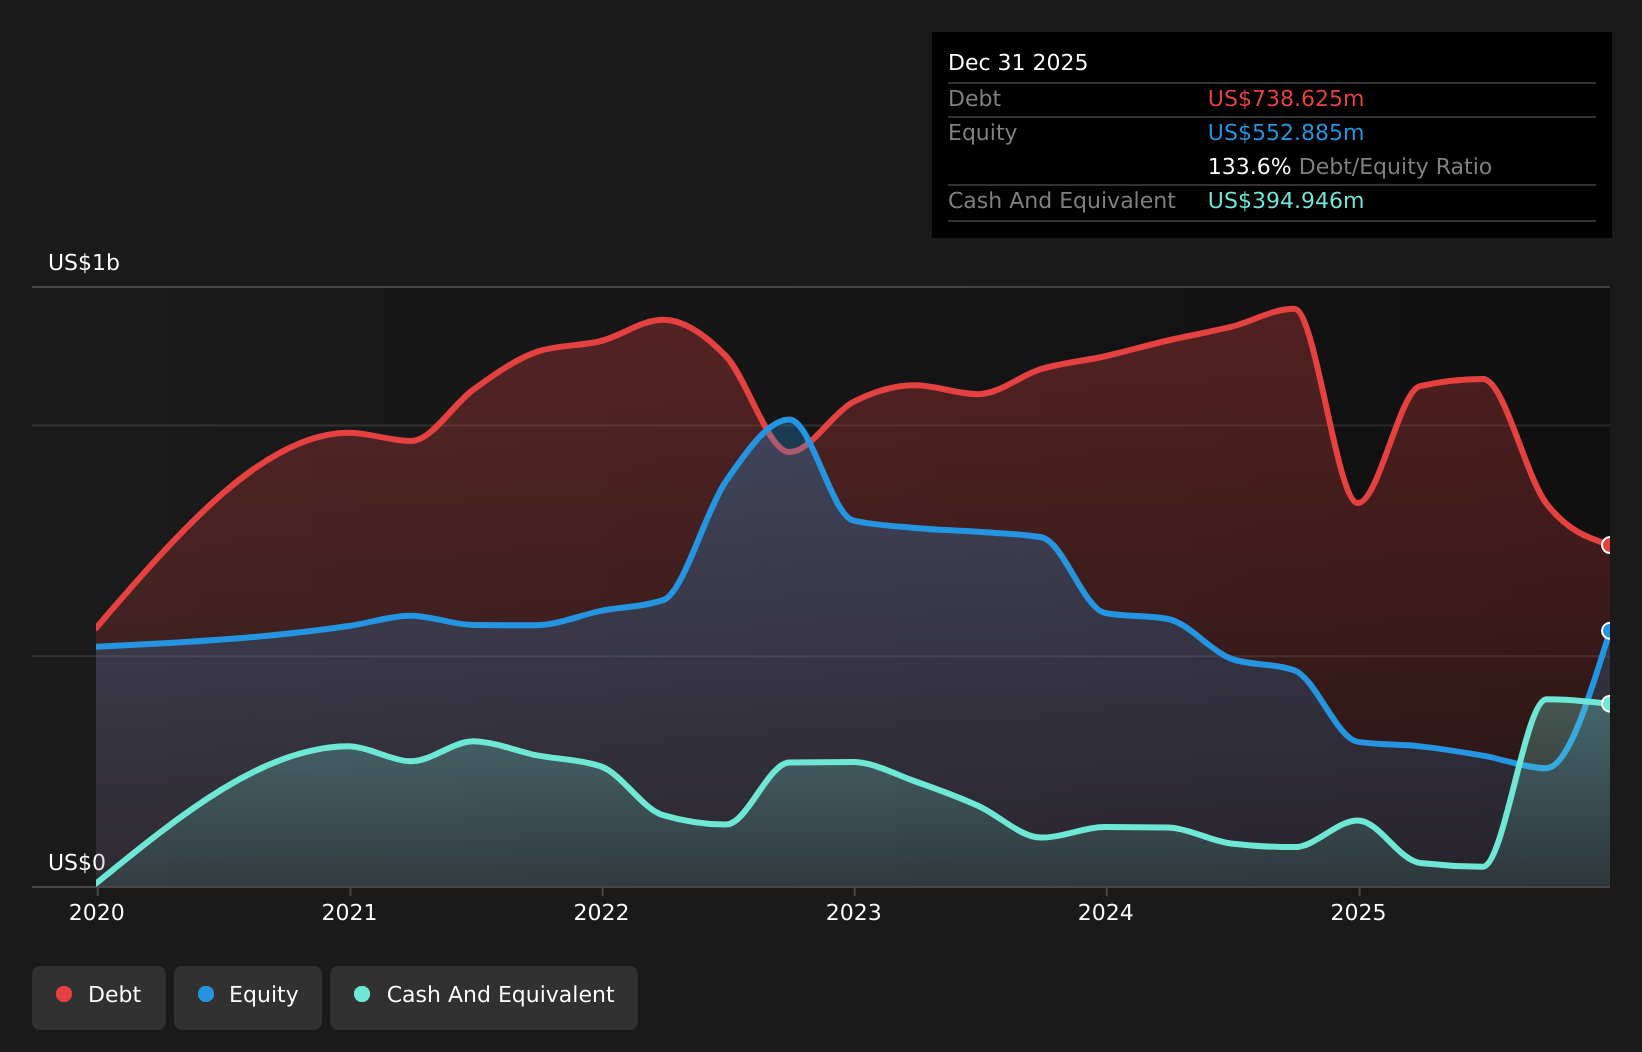
Overview: Apartment Investment and Management Company is a diversified real estate firm concentrating on value-add and opportunistic investments in the U.S., with a market cap of approximately $648.41 million.
Operations: The company generates revenue primarily from its Operating segment, which accounts for $72.52 million, and its Development segment, contributing $27.52 million.
Market Cap: $648.41M
Apartment Investment and Management Company faces challenges typical of penny stocks, with recent impairments totaling US$90.08 million impacting its financials. Despite a market cap of approximately US$648.41 million, the company struggles with profitability, evidenced by a negative return on equity and growing losses over the past five years. Its short-term assets of US$567.2 million surpass short-term liabilities but fall short against long-term liabilities of US$749.7 million, highlighting balance sheet concerns. The company's removal from multiple indices underscores investor caution, though it maintains a cash runway exceeding three years based on current free cash flow levels.
- Click to explore a detailed breakdown of our findings in Apartment Investment and Management's financial health report.
- Evaluate Apartment Investment and Management's historical performance by accessing our past performance report.
Similarweb (SMWB)
Simply Wall St Financial Health Rating: ★★★★★☆
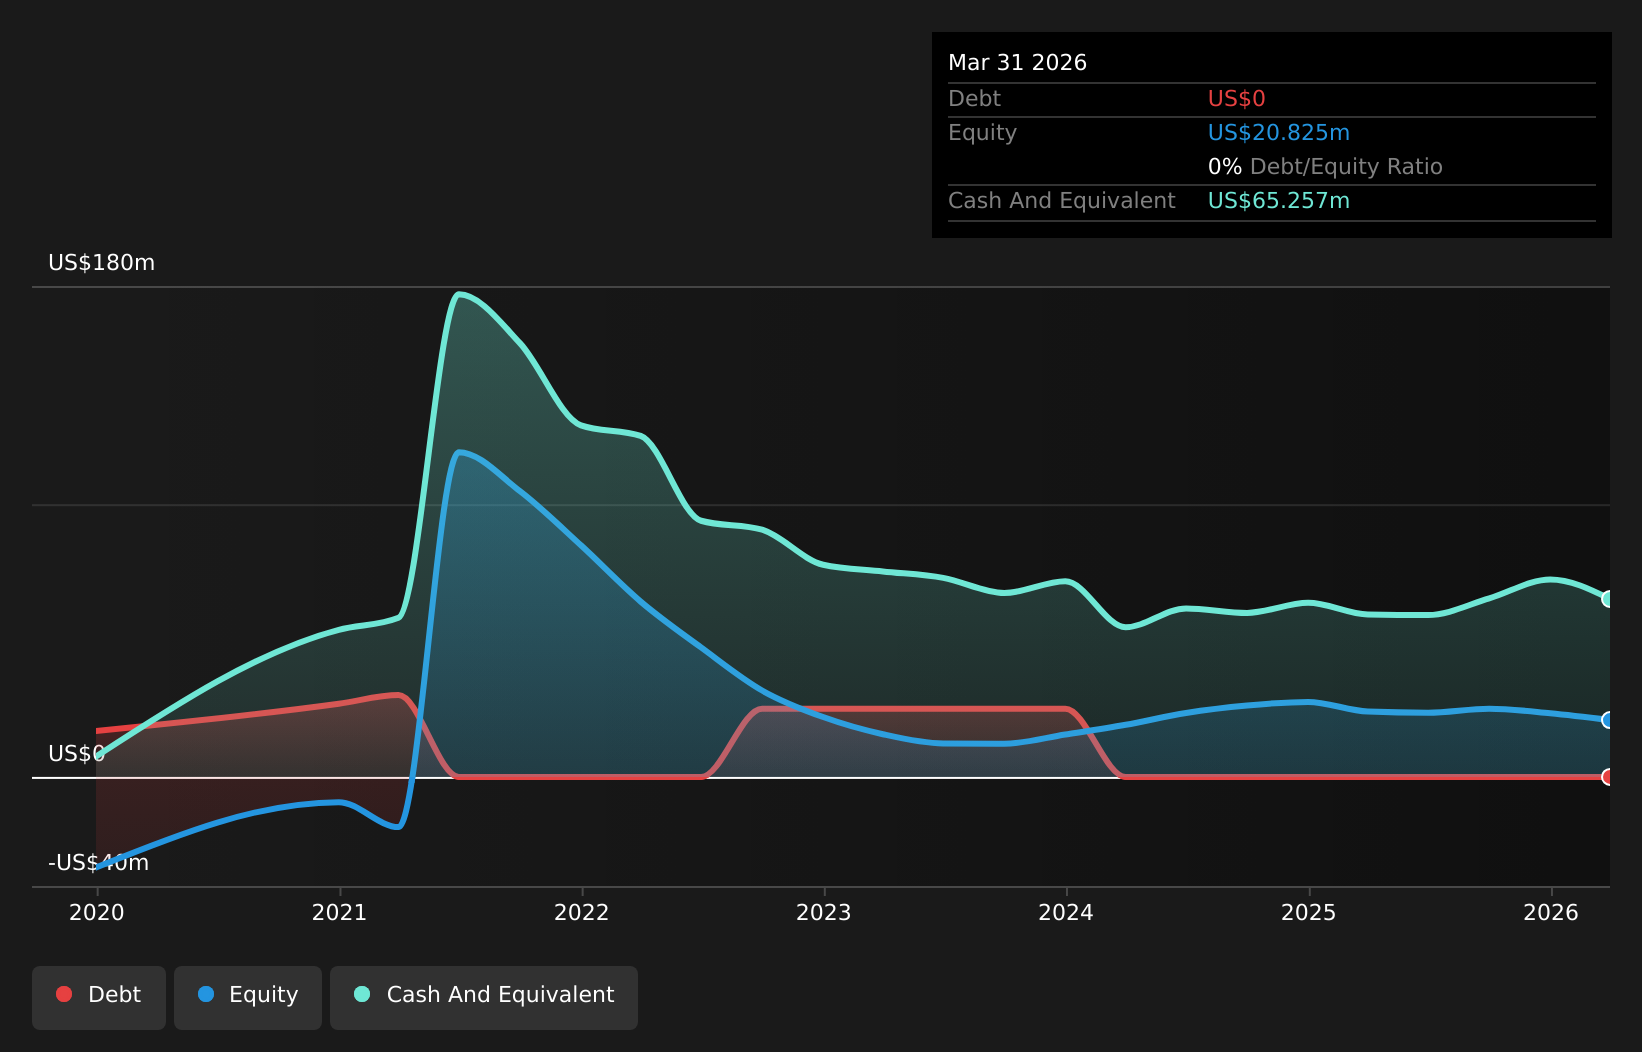
Overview: Similarweb Ltd. offers digital data and analytics services to support critical business decisions globally, with a market cap of approximately $228.72 million.
Operations: The company's revenue is derived entirely from its online financial information providers segment, totaling $282.6 million.
Market Cap: $228.72M
Similarweb Ltd. operates within the digital data and analytics sector, offering insights crucial for business decisions. With a market cap of US$228.72 million, it remains unprofitable but has reduced losses over five years by 18.8% annually. Recent strategic moves include a collaboration with Rakuten Advertising to enhance AI-driven digital marketing capabilities and the launch of an advanced Retail Intelligence suite, expanding its analytical offerings across major online platforms like Amazon. Despite short-term liabilities exceeding assets, Similarweb's cash runway exceeds three years due to positive free cash flow growth, positioning it strategically in a competitive landscape.
- Dive into the specifics of Similarweb here with our thorough balance sheet health report.
- Evaluate Similarweb's prospects by accessing our earnings growth report.
Taking Advantage
- Unlock more gems! Our US Penny Stocks screener has unearthed 342 more companies for you to explore.Click here to unveil our expertly curated list of 345 US Penny Stocks.
- Seeking Other Investments? AI is about to change healthcare. These 129 stocks are working on everything from early diagnostics to drug discovery. The best part - they are all under $10b in market cap - there's still time to get in early.
This article by Simply Wall St is general in nature. We provide commentary based on historical data and analyst forecasts only using an unbiased methodology and our articles are not intended to be financial advice. It does not constitute a recommendation to buy or sell any stock, and does not take account of your objectives, or your financial situation. We aim to bring you long-term focused analysis driven by fundamental data. Note that our analysis may not factor in the latest price-sensitive company announcements or qualitative material. Simply Wall St has no position in any stocks mentioned.
Have feedback on this article? Concerned about the content? Get in touch with us directly. Alternatively, email editorial-team@simplywallst.com