


- If you are wondering whether Janus Henderson Group is still reasonably priced after its strong run, this breakdown will help you frame what the current share price could mean for value.
- The stock closed at US$51.53 recently, with returns of 2.2% over 30 days, 7.8% year to date, 79.4% over 1 year, 123.5% over 3 years and 90.6% over 5 years. This naturally raises questions about how much of the story is already reflected in the price.
- Recent coverage has focused on how Janus Henderson Group fits into investor interest in capital markets names and what that might imply for risk appetite in the sector. For anyone watching the stock, this context helps explain why sentiment around the shares has been changing.
- On Simply Wall St's 6 point valuation checklist, Janus Henderson Group currently scores 3 out of 6. The sections that follow will break that into traditional valuation methods while also pointing to a different way of thinking about value that ties everything together at the end of the article.
Approach 1: Janus Henderson Group Excess Returns Analysis
The Excess Returns model looks at how much profit a company is expected to generate above the return required by its shareholders, then converts that stream of “excess” into a per share value.
For Janus Henderson Group, the inputs point to a relatively modest gap between required and expected earnings power. Book value is $33.17 per share and the stable earnings per share estimate is $2.56, based on the median return on equity from the past 5 years. The cost of equity is $2.39 per share, which leaves an excess return of $0.17 per share. The average return on equity used in the model is 9.15%, applied to a stable book value of $28.04 per share, sourced from the median book value over the past 5 years.
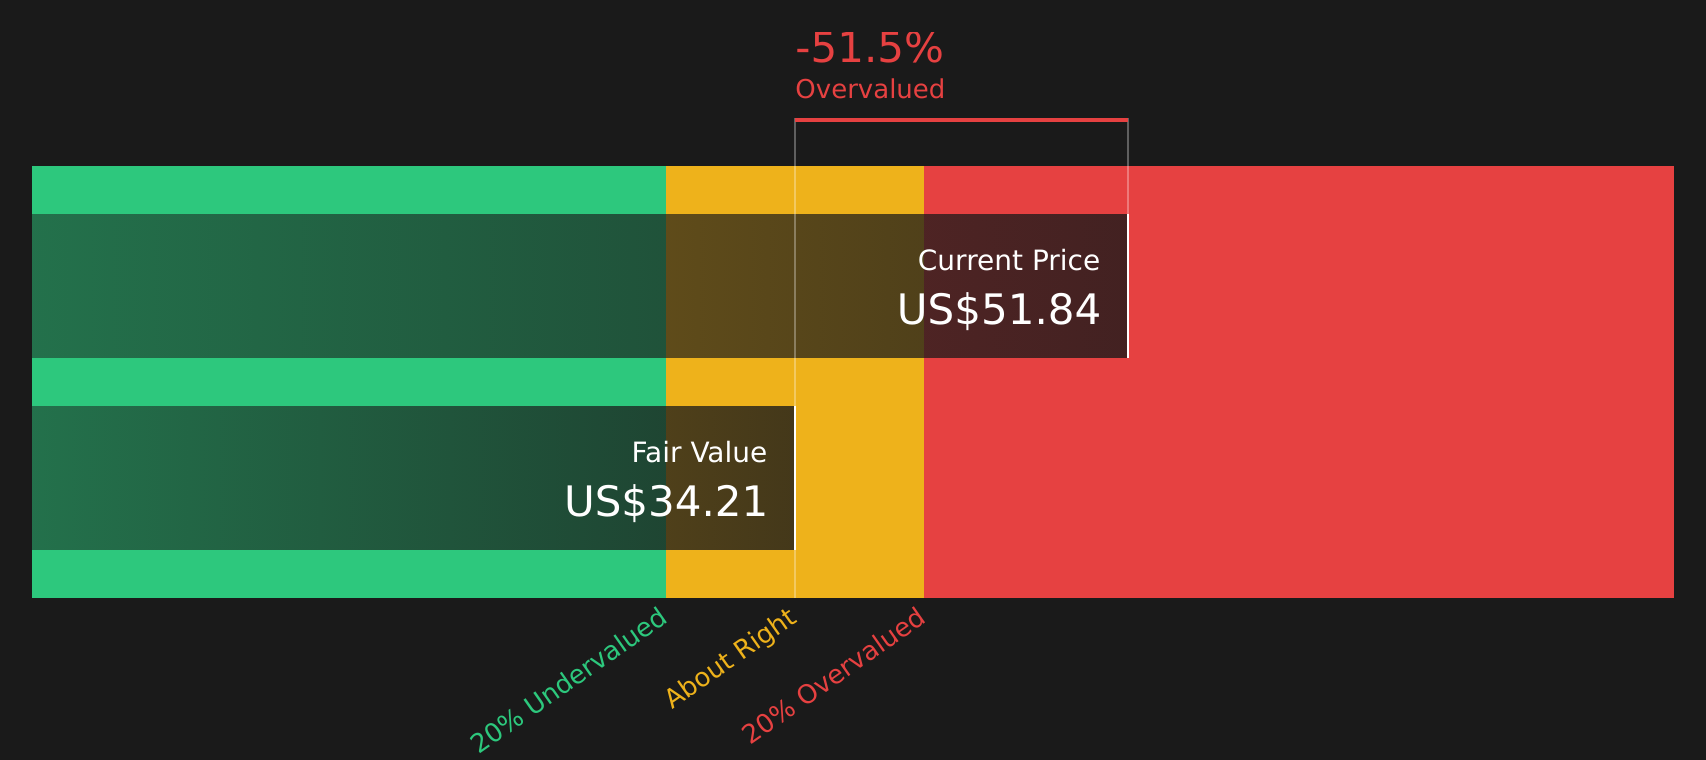
Putting these assumptions together, the Excess Returns model produces an intrinsic value of about $31.42 per share. Compared with the recent share price of $51.53, this framework suggests the stock is 64.0% overvalued.
Result: OVERVALUED
Our Excess Returns analysis suggests Janus Henderson Group may be overvalued by 64.0%. Discover 63 high quality undervalued stocks or create your own screener to find better value opportunities.
Approach 2: Janus Henderson Group Price vs Earnings
For a profitable business like Janus Henderson Group, the P/E ratio is a straightforward way to connect what you pay for each share with the earnings that back it. Investors generally look for a P/E that matches their expectations for future growth and the level of risk they are taking on, with higher growth or lower perceived risk often supporting a higher “normal” P/E.
Janus Henderson Group currently trades on a P/E of 9.94x. That sits below the Capital Markets industry average P/E of 41.97x and also below the peer group average of 13.81x. On the surface, that gap suggests the market is assigning a lower earnings multiple to the stock than to many of its industry peers.
Simply Wall St’s Fair Ratio for Janus Henderson Group is 10.30x. This is a proprietary estimate of what the P/E might be given factors such as earnings growth, profit margins, industry, market cap and company specific risks. Because it adjusts for these drivers, it can be more informative than a simple comparison with raw industry or peer averages. With the current P/E of 9.94x sitting below the Fair Ratio of 10.30x, the shares appear modestly undervalued on this metric.
Result: UNDERVALUED

P/E ratios tell one story, but what if the real opportunity lies elsewhere? Start investing in legacies, not executives. Discover our 19 top founder-led companies.
Upgrade Your Decision Making: Choose your Janus Henderson Group Narrative
Earlier it was mentioned that there is an even better way to understand valuation, so Narratives on Simply Wall St let you connect your view of Janus Henderson Group’s future with a set of numbers by turning a story about revenue, earnings and margins into a forecast that produces a Fair Value you can compare with today’s share price to help decide whether the stock looks attractive or expensive.
A Narrative is simply your version of the company’s story, written in numbers, and it links what you think will happen to Janus Henderson Group’s business to a financial model that estimates future revenue, earnings, margins and a reasonable P/E, then converts that into a Fair Value per share.
On Simply Wall St’s Community page, Narratives are designed to be easy to use so you can pick or adjust assumptions rather than build a spreadsheet, see the Fair Value that falls out of those inputs, and then weigh that against the current market price to decide if the gap is large enough for you to act or to wait.
Narratives also respond to new information like news or earnings updates, so when the outlook for flows, margins or corporate actions changes, the Fair Value view updates with it rather than staying frozen.
For Janus Henderson Group, one investor might build a more optimistic Narrative using assumptions similar to the higher analyst Fair Value of about US$52.33. Another might lean on a more cautious Narrative closer to the lower Fair Value of about US$41.45, and seeing those side by side makes it easier to decide which story feels closer to your own expectations.
For Janus Henderson Group, here are previews of two leading Janus Henderson Group Narratives for easy comparison:
🐂 Janus Henderson Group Bull Case
Fair value in this bullish narrative: US$52.00 per share.
At the recent price of US$51.53, this view implies the stock is about 0.9% undervalued relative to that fair value.
Revenue growth assumption: 29.66%.
- Assumes revenue stays broadly flat in the near term while profit margins ease from 25.8% to 18.7%, with earnings of US$582.8m and earnings per share of US$4.14 by around April 2029.
- Relies on a higher future P/E of 16.4x on those 2029 earnings, compared with about 10.0x today, and uses an 8.37% discount rate to bring those cash flows back to today.
- Highlights both headwinds such as fee pressure, higher tech and compliance costs, and regulatory risk, and potential offsets including strong investment performance, positive flows and product expansion in ETFs and alternatives.
🐻 Janus Henderson Group Bear Case
Fair value in this cautious narrative: US$41.45 per share.
At the recent price of US$51.53, this view implies the stock is about 24.3% overvalued relative to that fair value.
Revenue growth assumption: 4.65%.
- Frames Janus Henderson Group as a financial stock where valuation can be influenced by interest rate sensitivity, complex business drivers and how investors feel about balance sheet risk.
- Treats the shares as more of a capital allocation and balance sheet story than a high growth case, with an assumed future P/E of 13.11x and a discount rate of 8.75% feeding into the lower fair value.
- Flags that regulation, market volatility and sector wide shifts in how risk is priced can all affect sentiment, which in this view supports a lower value than the current market price.
These two Narratives bracket a reasonable range of outcomes and provide a structured way to test which assumptions feel closer to your own expectations for the business, its margins and the price you are willing to pay for the stock.
See what the community is saying about Janus Henderson Group
Do you think there's more to the story for Janus Henderson Group? Head over to our Community to see what others are saying!

This article by Simply Wall St is general in nature. We provide commentary based on historical data and analyst forecasts only using an unbiased methodology and our articles are not intended to be financial advice. It does not constitute a recommendation to buy or sell any stock, and does not take account of your objectives, or your financial situation. We aim to bring you long-term focused analysis driven by fundamental data. Note that our analysis may not factor in the latest price-sensitive company announcements or qualitative material. Simply Wall St has no position in any stocks mentioned.
Have feedback on this article? Concerned about the content? Get in touch with us directly. Alternatively, email editorial-team@simplywallst.com