


Over the last 7 days, the United States market has risen by 1.3% and is up 35% over the past year, with earnings expected to grow by 16% annually in the coming years. In this environment of robust growth, identifying stocks that are potentially undervalued can offer opportunities for investors seeking value amidst a rising market.
Top 10 Undervalued Stocks Based On Cash Flows In The United States
| Name | Current Price | Fair Value (Est) | Discount (Est) |
| Tenable Holdings (TENB) | $20.11 | $39.98 | 49.7% |
| Glaukos (GKOS) | $122.11 | $243.41 | 49.8% |
| First Busey (BUSE) | $26.30 | $51.46 | 48.9% |
| FB Financial (FBK) | $53.66 | $104.99 | 48.9% |
| DNOW (DNOW) | $11.94 | $23.54 | 49.3% |
| Commvault Systems (CVLT) | $93.63 | $184.73 | 49.3% |
| Coastal Financial (CCB) | $81.82 | $161.96 | 49.5% |
| Cadre Holdings (CDRE) | $29.45 | $57.57 | 48.8% |
| BioHarvest Sciences (BHST) | $4.40 | $8.60 | 48.8% |
| Ategrity Specialty Insurance Company Holdings (ASIC) | $20.60 | $41.00 | 49.8% |
We're going to check out a few of the best picks from our screener tool.
Gloo Holdings (GLOO)
Overview: Gloo Holdings, Inc. designs and develops a vertical technology platform for the faith and flourishing ecosystem, with a market cap of $644.58 million.
Operations: The company generates revenue through its vertical technology platform tailored for the faith and flourishing ecosystem.
Estimated Discount To Fair Value: 46.2%
Gloo Holdings is trading at US$7.61, significantly below its estimated future cash flow value of US$14.14, indicating potential undervaluation. Despite a volatile share price and a short cash runway, Gloo's revenue is projected to grow 31% annually, outpacing the market average. Recent earnings showed substantial revenue growth from US$6.5 million to US$33.63 million year-over-year, though net losses persist at US$49.33 million for the quarter ending January 2026.
- Our comprehensive growth report raises the possibility that Gloo Holdings is poised for substantial financial growth.
- Get an in-depth perspective on Gloo Holdings' balance sheet by reading our health report here.
Omada Health (OMDA)
Overview: Omada Health, Inc., along with its subsidiary Physera, Inc., offers virtual care programs in the United States and has a market cap of $827.31 million.
Operations: Omada Health generates revenue of $260.21 million from its virtual care program product offerings in the United States.
Estimated Discount To Fair Value: 39%
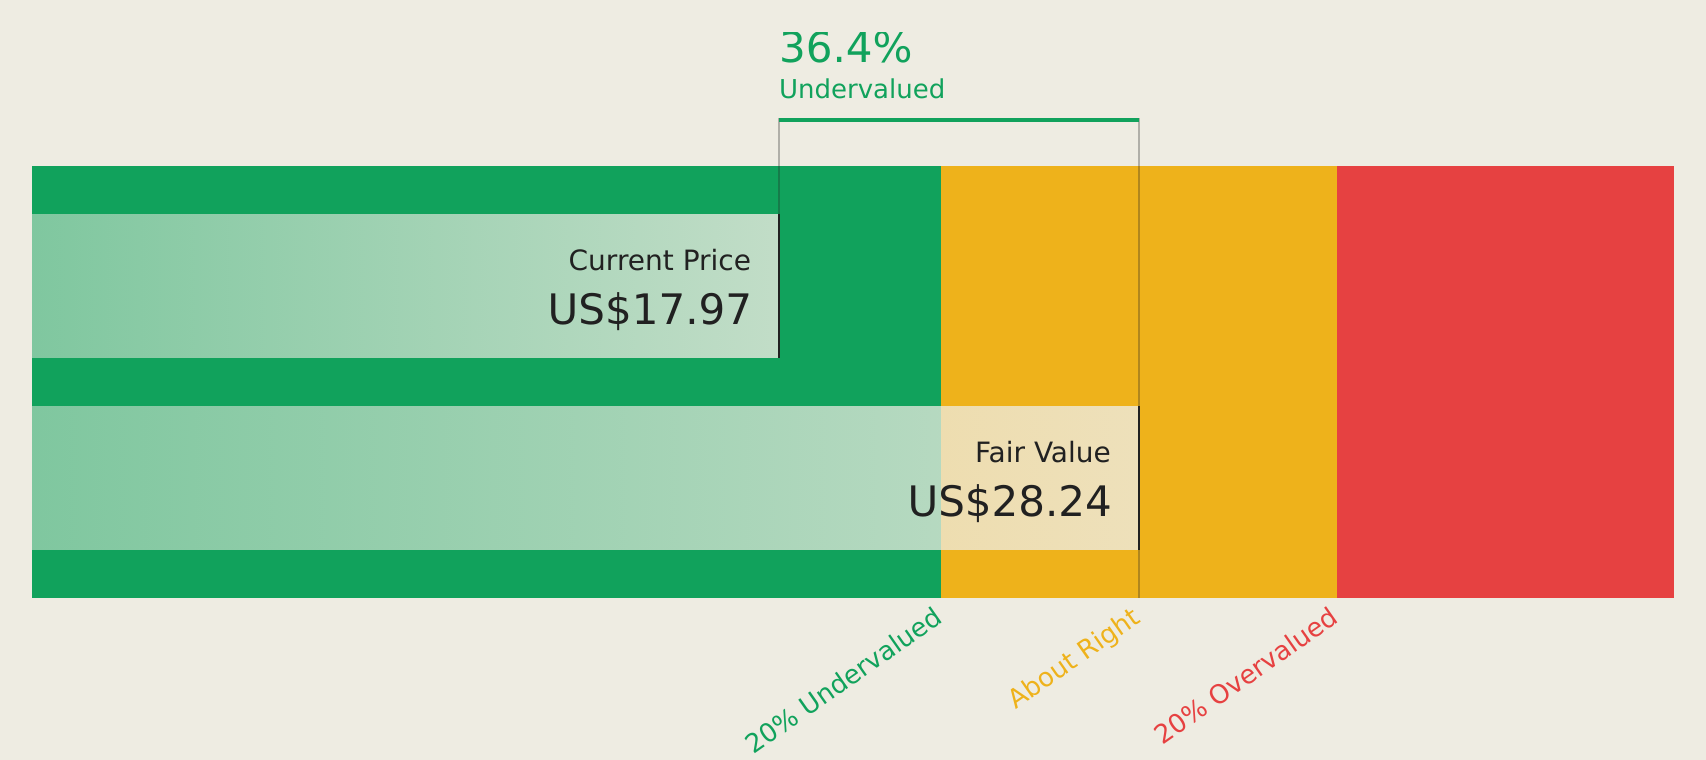
Omada Health's stock is trading at US$14.29, below its estimated future cash flow value of US$23.43, suggesting potential undervaluation. The company reported significant revenue growth from US$169.8 million to US$260.21 million year-over-year, with a shift to profitability in the latest quarter showing net income of US$5.16 million compared to a prior loss. Recent product advancements and strategic initiatives could enhance cash flow prospects despite moderate revenue growth forecasts relative to market averages.
- Upon reviewing our latest growth report, Omada Health's projected financial performance appears quite optimistic.
- Click here to discover the nuances of Omada Health with our detailed financial health report.
Newsmax (NMAX)
Overview: Newsmax Inc. operates as a television broadcaster and multi-platform content publisher in the United States, with a market cap of approximately $916.88 million.
Operations: The company's revenue segments include $35.92 million from digital operations and $153.34 million from broadcasting activities.
Estimated Discount To Fair Value: 43.4%
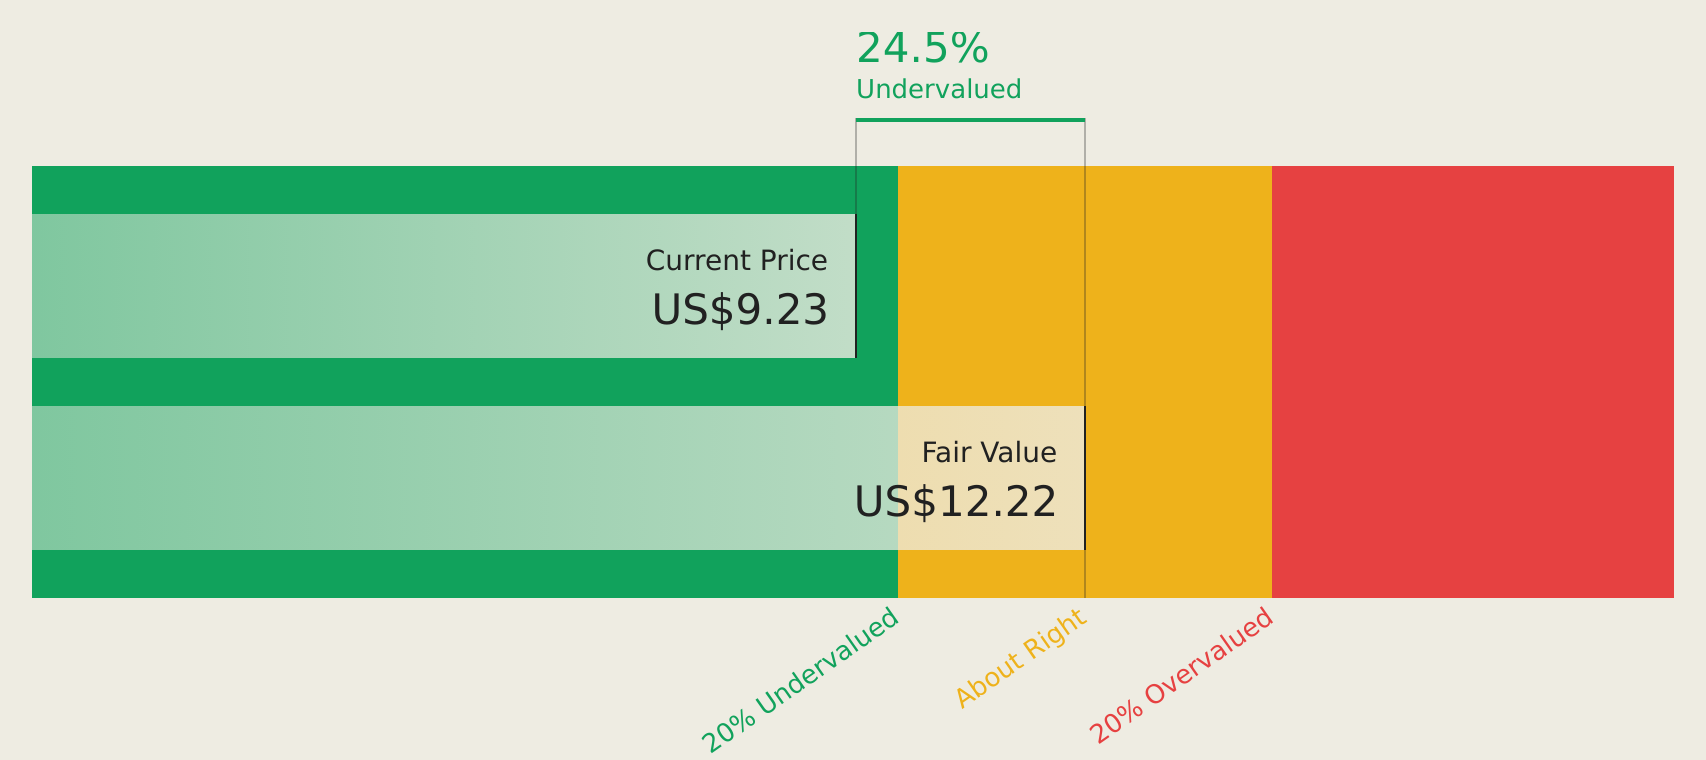
Newsmax Inc. is trading at US$7.28, significantly below its estimated future cash flow value of US$12.86, indicating potential undervaluation based on discounted cash flow analysis. Despite a net loss of US$99.5 million for 2025, revenue increased to US$189.25 million from the previous year’s US$171.02 million, and earnings are projected to grow substantially by 118.67% annually as profitability is anticipated within three years, outpacing market averages in growth expectations.
- The analysis detailed in our Newsmax growth report hints at robust future financial performance.
- Click to explore a detailed breakdown of our findings in Newsmax's balance sheet health report.
Next Steps
- Dive into all 153 of the Undervalued US Stocks Based On Cash Flows we have identified here.
- Have a stake in these businesses? Integrate your holdings into Simply Wall St's portfolio for notifications and detailed stock reports.
- Elevate your portfolio with Simply Wall St, the ultimate app for investors seeking global market coverage.
Seeking Other Investments?
- Explore high-performing small cap companies that haven't yet garnered significant analyst attention.
- Diversify your portfolio with solid dividend payers offering reliable income streams to weather potential market turbulence.
- Fuel your portfolio with companies showing strong growth potential, backed by optimistic outlooks both from analysts and management.
This article by Simply Wall St is general in nature. We provide commentary based on historical data and analyst forecasts only using an unbiased methodology and our articles are not intended to be financial advice. It does not constitute a recommendation to buy or sell any stock, and does not take account of your objectives, or your financial situation. We aim to bring you long-term focused analysis driven by fundamental data. Note that our analysis may not factor in the latest price-sensitive company announcements or qualitative material. Simply Wall St has no position in any stocks mentioned.
Have feedback on this article? Concerned about the content? Get in touch with us directly. Alternatively, email editorial-team@simplywallst.com