


- If you are wondering whether A10 Networks at around US$26.85 is priced attractively or already baking in a lot of optimism, this breakdown is designed to help you frame that question clearly.
- The stock has seen a 2.6% decline over the last 7 days, alongside returns of 11.9% over 30 days, 54.8% year to date, 65.9% over 1 year, 104.3% over 3 years and 214.4% over 5 years. These movements can change how the market views both its potential and its risks.
- Recent coverage has focused on A10 Networks as investors look for ongoing updates and context around its business and share price. This helps to keep the stock on the radar for those tracking the software space. This article was prompted to give evergreen context so you can step back from short term headlines and focus on what the current price could imply about long term value.
- A10 Networks currently has a valuation score of 1 out of 6. Next you will see how different valuation approaches interpret that, before finishing with a more complete way to think about what the market might be missing.
A10 Networks scores just 1/6 on our valuation checks. See what other red flags we found in the full valuation breakdown.
Approach 1: A10 Networks Discounted Cash Flow (DCF) Analysis
A Discounted Cash Flow, or DCF, model projects a company’s future cash flows and then discounts them back to today’s value to estimate what the business might be worth right now.
For A10 Networks, the model used is a 2 Stage Free Cash Flow to Equity approach. The company’s latest twelve month free cash flow is about $54.0 million. Analysts provide forecasts out to 2027, with free cash flow for that year projected at $93.1 million, and Simply Wall St then extrapolates cash flows further, reaching an estimated $163.8 million in 2035.
When all those projected cash flows are discounted back using the DCF method, the resulting intrinsic value comes out at around $29.78 per share. Compared with the recent share price of about $26.85, the model implies the stock is trading at roughly a 9.8% discount, which is a relatively small gap.
Result: ABOUT RIGHT
A10 Networks is fairly valued according to our Discounted Cash Flow (DCF), but this can change at a moment's notice. Track the value in your watchlist or portfolio and be alerted on when to act.
Approach 2: A10 Networks Price vs Earnings
For profitable companies, the P/E ratio is a useful way to think about what you are paying for each dollar of earnings. It connects directly to how quickly those earnings might grow and how predictable they are, so it is a familiar shorthand for many investors.
In general, higher growth expectations and lower perceived risk can justify a higher P/E ratio, while slower growth or higher risk tend to support a lower, more conservative multiple. That context matters when you look at the headline numbers for A10 Networks.
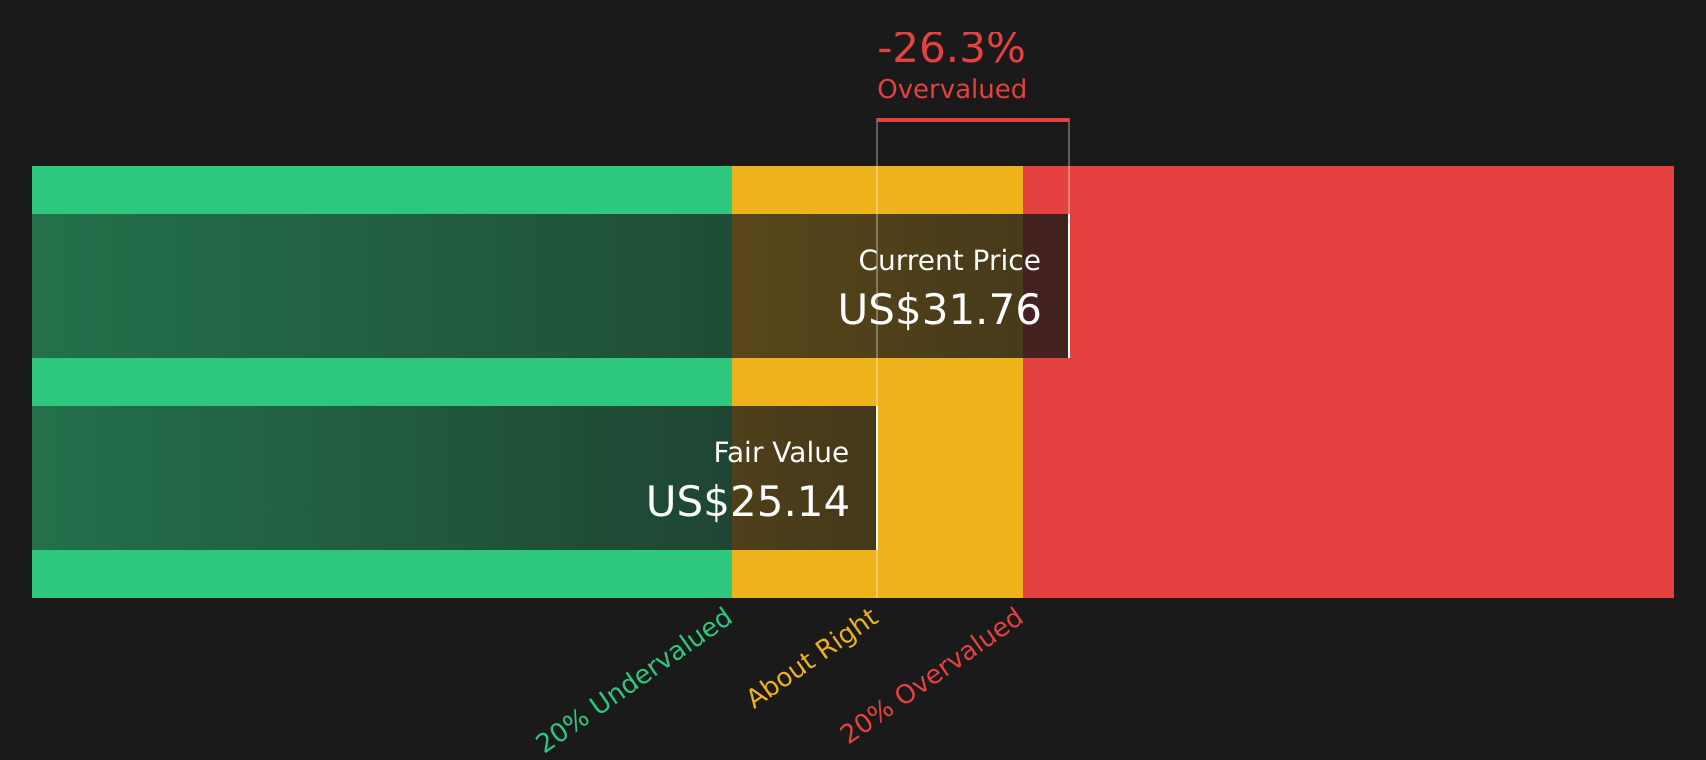
A10 Networks currently trades on a P/E of about 43.2x, compared with the Software industry average of around 30.3x and a peer average of about 26.5x. Simply Wall St also calculates a proprietary “Fair Ratio” of 24.2x. This Fair Ratio reflects factors such as A10 Networks earnings growth profile, profit margin, industry, market cap and risk characteristics. It aims to be more tailored than a simple comparison with peers or the broad industry.
Set against that Fair Ratio, the current P/E of 43.2x is materially higher, which suggests the shares are pricing in stronger conditions than the Fair Ratio alone would indicate.
Result: OVERVALUED

P/E ratios tell one story, but what if the real opportunity lies elsewhere? Start investing in legacies, not executives. Discover our 17 top founder-led companies.
Upgrade Your Decision Making: Choose your A10 Networks Narrative
Earlier it was mentioned that there is an even better way to understand valuation, so Narratives are introduced here as a simple way for you to connect your view of A10 Networks business to a set of revenue, earnings and margin estimates, and then to a clear fair value that can be compared with the current price on Simply Wall St's Community page, where Narratives created by millions of investors are updated automatically when fresh information like news or earnings is added. One investor might build a Narrative around strong AI related demand, higher margins and a fair value above the current analyst consensus of US$25.17. Another might focus on execution and customer concentration risks, assume more cautious numbers and arrive at a fair value closer to the lower analyst target of US$22. This gives you a fast way to see how different stories translate into different fair values and into your own buy, hold or sell decisions.
Do you think there's more to the story for A10 Networks? Head over to our Community to see what others are saying!

This article by Simply Wall St is general in nature. We provide commentary based on historical data and analyst forecasts only using an unbiased methodology and our articles are not intended to be financial advice. It does not constitute a recommendation to buy or sell any stock, and does not take account of your objectives, or your financial situation. We aim to bring you long-term focused analysis driven by fundamental data. Note that our analysis may not factor in the latest price-sensitive company announcements or qualitative material. Simply Wall St has no position in any stocks mentioned.
Have feedback on this article? Concerned about the content? Get in touch with us directly. Alternatively, email editorial-team@simplywallst.com