


Why VeriSign’s latest earnings, guidance and dividend matter for investors
VeriSign (VRSN) has drawn fresh attention after reporting first quarter 2026 results alongside updated full year guidance and a Board approved cash dividend, giving investors several new data points to assess.
See our latest analysis for VeriSign.
The earnings beat, fresh 2026 guidance and the approved US$0.81 dividend have coincided with firmer sentiment, with a 30 day share price return of 6.13% and a 14.65% year to date share price return. The 1 year total shareholder return is slightly negative and multi year total shareholder returns remain positive, pointing to improving short term momentum against a mixed longer term picture.
If these earnings have you thinking about where else growth or income might show up in your portfolio, it can be useful to scan beyond a single stock and review 19 top founder-led companies
With the stock up over the past quarter and trading around US$275, the key question is whether recent earnings, guidance and the new dividend leave VeriSign undervalued, or if the market is already pricing in future growth.
Most Popular Narrative: 67.1% Overvalued
VeriSign last closed at $275.77 while the most followed narrative pegs fair value at $165, so readers are dealing with a wide gap between price and that thesis.
In light of the above, the risk profile for VeriSign extends beyond typical financial or competitive concerns and includes tangible legal and regulatory hazards rooted in internal management conduct and culture. The combination of credible internal complaints, documented evidence, and the willingness of former employees to pursue litigation creates a non-trivial likelihood of material legal actions and adverse disclosures.
The narrative, put forward by ValueInvestor_2026, leans heavily on assumptions about legal exposure, contract renewals and how a single product focus could influence long term profitability. It treats revenue growth, margins and required return as a tight equation that only works if VeriSign maintains its current position without disruption, and it applies a discount rate that reflects those perceived risks without spelling out every step of the math.
Result: Fair Value of $165 (OVERVALUED)
Have a read of the narrative in full and understand what's behind the forecasts.
However, concentrated reliance on .com and .net, or any easing of perceived legal and regulatory pressures, could challenge the bearish $165 fair value argument.
Find out about the key risks to this VeriSign narrative.
Another angle on valuation: pricing vs peers
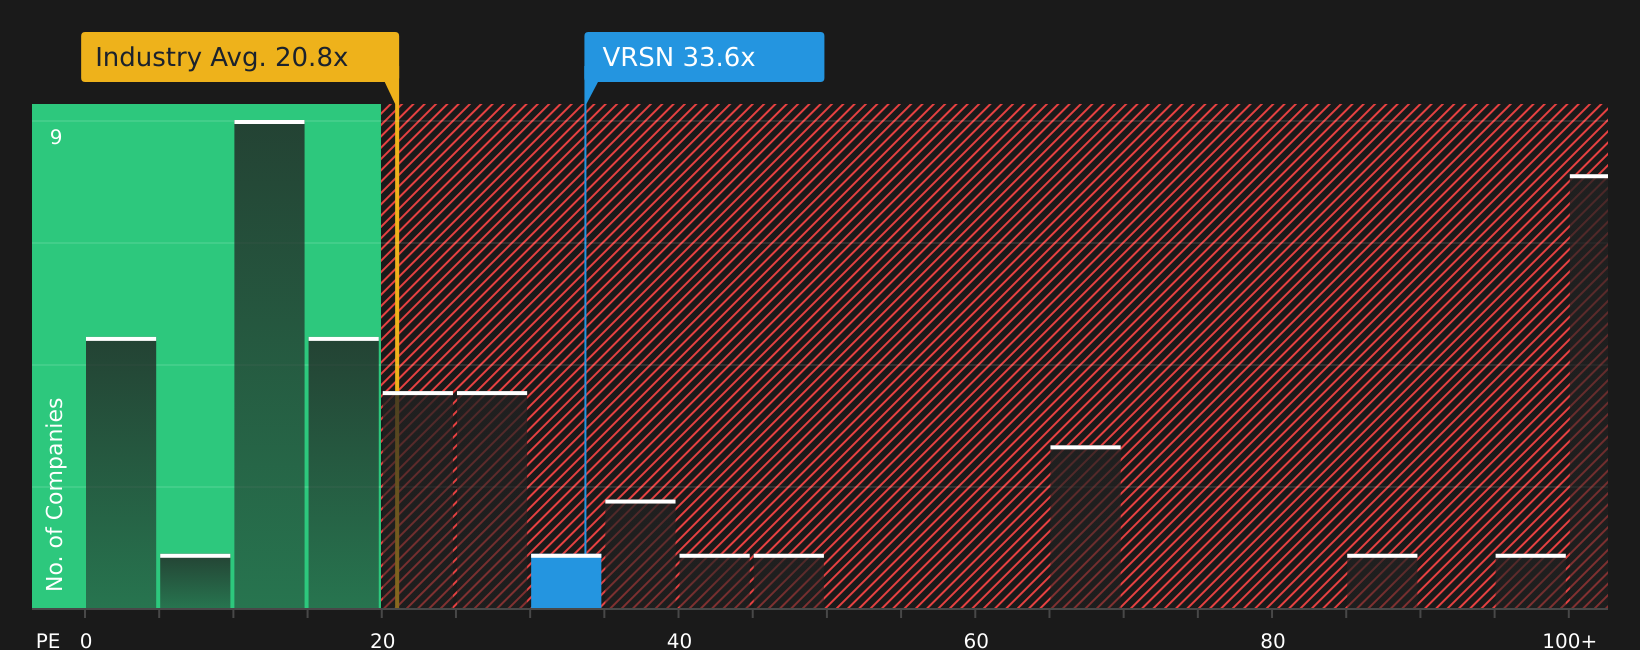
That $165 narrative fair value leans heavily on legal and concentration risks, but the market is also sending a mixed signal through simple pricing ratios. VeriSign trades on a P/E of 29.9x, which is lower than the peer average of 42.9x yet higher than the US IT industry average of 21x.
Against the fair ratio of 22.9x, the current 29.9x suggests limited room for disappointment if growth or pricing power soften, while still leaving some investors arguing it is cheaper than closer peers. With three different numbers in play, which reference point do you trust most when you look at $275.77?
See what the numbers say about this price — find out in our valuation breakdown.
Next Steps
The mix of optimism and concern around VeriSign is clear. It can be helpful to move quickly, review the numbers yourself and decide where you stand using the 2 key rewards and 3 important warning signs
Looking for more investment ideas?
If VeriSign has sharpened your thinking, do not stop here. Fresh ideas across different styles can help balance your risk and return expectations.
- Tap into potential mispricings by reviewing the screener containing 25 high quality undiscovered gems that combine quality fundamentals with limited market attention.
- Build more resilience into your portfolio with the 72 resilient stocks with low risk scores focused on companies that our model scores with lower overall risk.
- Strengthen your core holdings by checking the solid balance sheet and fundamentals stocks screener (46 results) that highlights stocks with stronger financial footing and fundamentals.
This article by Simply Wall St is general in nature. We provide commentary based on historical data and analyst forecasts only using an unbiased methodology and our articles are not intended to be financial advice. It does not constitute a recommendation to buy or sell any stock, and does not take account of your objectives, or your financial situation. We aim to bring you long-term focused analysis driven by fundamental data. Note that our analysis may not factor in the latest price-sensitive company announcements or qualitative material. Simply Wall St has no position in any stocks mentioned.
Have feedback on this article? Concerned about the content? Get in touch with us directly. Alternatively, email editorial-team@simplywallst.com