


- Wondering if AES is genuinely good value at around US$14.29, or if the recent excitement is already priced in? This article breaks down what the numbers actually say.
- The stock has delivered a 38.9% return over the last year, even though the 7 day, 30 day and year to date returns are slightly negative.
- Recent coverage has focused on AES within broader discussions about utilities and power infrastructure, giving context to how investors think about companies exposed to energy demand and grid investment. This kind of attention can influence how the market frames both the risks and potential of a stock like AES.
- AES currently has a valuation score of 5/6. The rest of this article will walk through what that means using different valuation approaches, then conclude with a way to look at valuation that goes beyond just the headline metrics.
Approach 1: AES Discounted Cash Flow (DCF) Analysis
A Discounted Cash Flow, or DCF, model takes projected future cash flows and discounts them back to today to estimate what the business might be worth now. It is essentially asking what those future dollars are worth in today’s money.
For AES, the model used is a 2 Stage Free Cash Flow to Equity approach, based on cash flow projections. The latest twelve month free cash flow is a loss of $2.19b, so the model relies heavily on future estimates. Analyst and extrapolated projections show free cash flow of $1.28b in 2026 and $1.38b in 2028, with further extrapolated figures reaching about $1.69b by 2035, all in dollars.
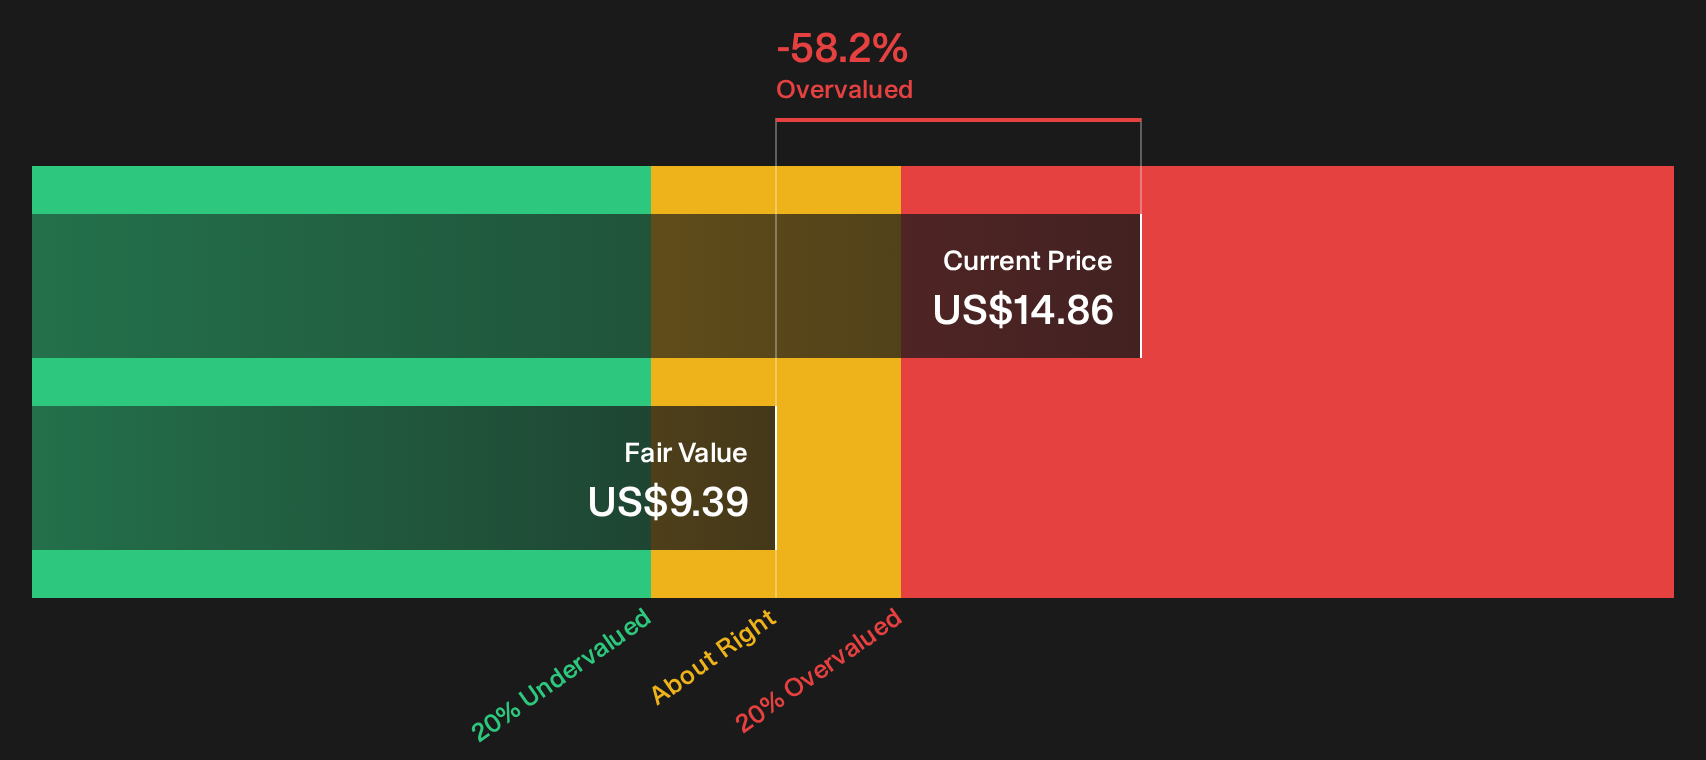
When those projected cash flows are discounted back, the DCF output suggests an intrinsic value of about $19.65 per share. Compared with a share price around $14.29, the model implies AES is 27.3% undervalued based on these assumptions.
Result: UNDERVALUED
Our Discounted Cash Flow (DCF) analysis suggests AES is undervalued by 27.3%. Track this in your watchlist or portfolio, or discover 51 more high quality undervalued stocks.
Approach 2: AES Price vs Earnings
For a profitable business, the P/E ratio is a useful way to connect what you pay for the stock with the earnings it currently generates. A higher or lower P/E often reflects what the market expects for future earnings growth and how much risk investors see in those earnings.
If investors expect stronger growth or view the stock as lower risk, they may accept a higher P/E as “normal” or “fair.” If growth expectations are modest or risks are higher, a lower P/E is usually seen as more reasonable.
AES currently trades on a P/E of 7.38x. That sits below the Renewable Energy industry average P/E of 16.98x and far below the peer group average of 46.72x. Simply Wall St’s Fair Ratio for AES is 25.13x, which is its estimate of what a reasonable P/E could be given factors such as earnings growth profile, industry, profit margin, market cap and key risks.
This Fair Ratio is more tailored than a simple comparison with industry or peers because it adjusts for AES specific characteristics instead of assuming all companies should trade on the same multiple. Set against the Fair Ratio of 25.13x, the current P/E of 7.38x suggests the stock is undervalued on this metric.
Result: UNDERVALUED

P/E ratios tell one story, but what if the real opportunity lies elsewhere? Start investing in legacies, not executives. Discover our 19 top founder-led companies.
Upgrade Your Decision Making: Choose your AES Narrative
Earlier it was mentioned that there is an even better way to understand valuation. On Simply Wall St you can use Narratives, where you pick or build a story for AES that links your view of its future revenue, earnings and margins to a forecast, a Fair Value, and a clear comparison with today’s price. All of this is presented in an easy tool on the Community page that updates when new news or earnings arrive. One investor might back a more optimistic AES view with a Fair Value around US$15.74, while another leans on a more cautious Fair Value around US$7.17. By seeing these side by side you can decide whether AES looks priced above, below, or close to the Fair Value that best matches your own story about the company.
For AES, however, we will make it really easy for you with previews of two leading AES Narratives:
Fair value in this bullish narrative: US$15.74 per share
Implied pricing gap vs last close: around 9% below that fair value
Revenue growth assumption: 12.32% a year
- Focuses on AES as a beneficiary of data center demand, energy storage and digital grid solutions, with higher recurring revenue and margins modeled into the story.
- Builds in higher revenue growth and some margin expansion compared with today, using a discount rate of 12.33% and a future P/E of 7.9x on 2029 earnings.
- Flags risks around interest costs, regulation, international exposure and future project economics, and encourages you to test the bullish assumptions against your own expectations for AES.
Fair value in this more cautious narrative: US$7.17 per share
Implied pricing gap vs last close: around 50% above that fair value
Revenue growth assumption: 4.05% a year
- Treats AES as a utility and power producer with a long history and broad institutional ownership, but anchors on a much lower fair value than the current share price.
- Highlights that AES pays a dividend and that various external sources have discussed earnings growth and valuation, yet still arrives at a fair value of US$7.17 using more conservative assumptions.
- Serves as a reminder that even when external commentary is positive, a cautious valuation view can point to less upside, especially if earnings growth or profitability fall short of optimistic expectations.
With these two narratives, you can place your own view of AES somewhere on the spectrum rather than treating any single fair value as a fixed answer. If you want to see the full context, underlying forecasts and risk checks that sit behind these stories, See what the community is saying about AES.
Do you think there's more to the story for AES? Head over to our Community to see what others are saying!

This article by Simply Wall St is general in nature. We provide commentary based on historical data and analyst forecasts only using an unbiased methodology and our articles are not intended to be financial advice. It does not constitute a recommendation to buy or sell any stock, and does not take account of your objectives, or your financial situation. We aim to bring you long-term focused analysis driven by fundamental data. Note that our analysis may not factor in the latest price-sensitive company announcements or qualitative material. Simply Wall St has no position in any stocks mentioned.
Have feedback on this article? Concerned about the content? Get in touch with us directly. Alternatively, email editorial-team@simplywallst.com