


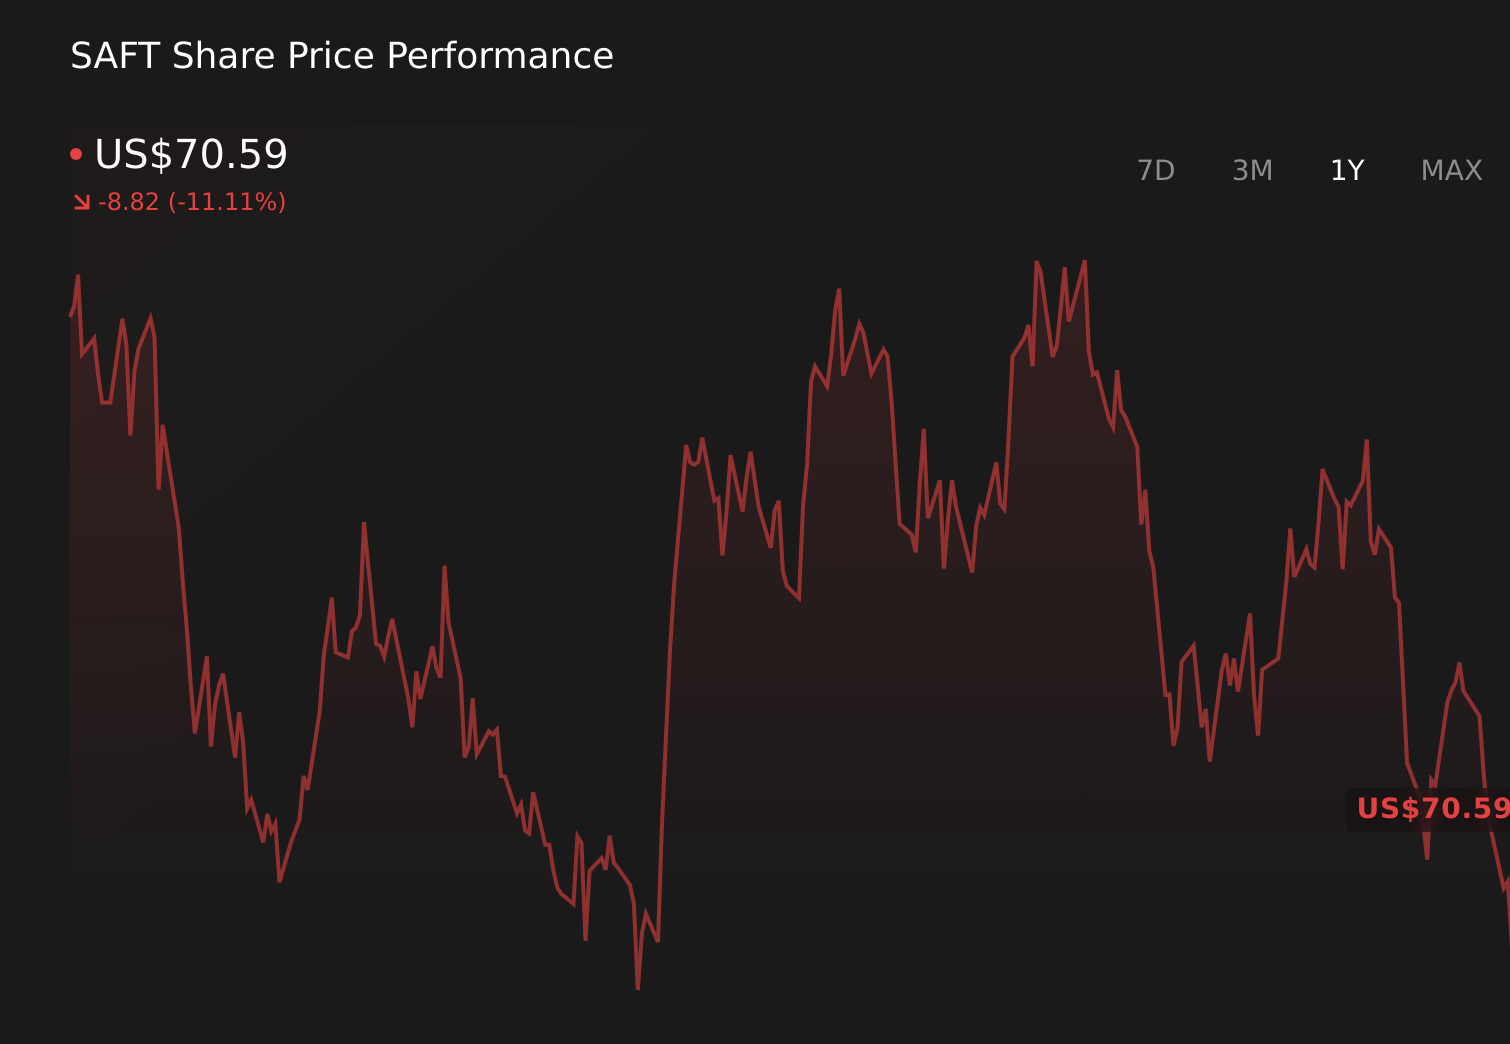
- Safety Insurance Group, Inc. reported past first-quarter 2026 results showing revenue of US$314.67 million, up from US$301.43 million a year earlier, but swinging from net income of US$21.9 million to a net loss of US$14.32 million, with basic and diluted loss per share of US$0.99.
- Alongside these weaker earnings, the company still affirmed a quarterly dividend of US$0.92 per share, payable on June 12, 2026, highlighting management’s commitment to ongoing shareholder cash returns despite the quarterly loss.
- We will now examine how the swing from profit to loss, despite higher revenue, may influence Safety Insurance Group’s investment narrative.
AI is about to change healthcare. These 32 stocks are working on everything from early diagnostics to drug discovery. The best part - they are all under $10b in market cap - there's still time to get in early.
What Is Safety Insurance Group's Investment Narrative?
To stay invested in Safety Insurance Group, you need to believe in a fairly traditional insurance story: a seasoned management team, an established dividend record, and a business that can turn written premiums into consistent underwriting and investment earnings over time. The latest quarter complicates that picture. Revenue grew, but the swing to a US$14.32 million loss and a loss per share of US$0.99 suggests higher claims, expenses or investment hits are now front and center, just as prior analysis was already flagging weaker profit trends and modest returns on equity. The reaffirmed US$0.92 dividend signals management still leans on income appeal as a key short term catalyst, but it also sharpens the main risk: whether current earnings power and capital levels comfortably support both the payout and any future shocks.
Safety Insurance Group's share price has been on the slide but might be up to 12% below fair value. Find out if it's a bargain.Exploring Other Perspectives
Simply Wall St Community members currently provide 1 fair value estimate at US$60.83, showing how even a single viewpoint can differ from market pricing. Set this against the recent swing to a quarterly loss and you can see why many investors will want to compare multiple opinions before deciding what Safety Insurance Group’s challenges might mean for its longer term performance.
Explore another fair value estimate on Safety Insurance Group - why the stock might be worth as much as $60.83!
Decide For Yourself
Disagree with this assessment? Extraordinary investment returns rarely come from following the herd, so go with your instincts.
- A great starting point for your Safety Insurance Group research is our analysis highlighting 2 key rewards and 1 important warning sign that could impact your investment decision.
- Our free Safety Insurance Group research report provides a comprehensive fundamental analysis summarized in a single visual - the Snowflake - making it easy to evaluate Safety Insurance Group's overall financial health at a glance.
Curious About Other Options?
Every day counts. These free picks are already gaining attention. See them before the crowd does:
- Find 50 companies with promising cash flow potential yet trading below their fair value.
- The best AI stocks today may lie beyond giants like Nvidia and Microsoft. Find the next big opportunity with these 16 smaller AI-focused companies with strong growth potential through early-stage innovation in machine learning, automation, and data intelligence that could fund your retirement.
- Rare earth metals are the new gold rush. Find out which 31 stocks are leading the charge.
This article by Simply Wall St is general in nature. We provide commentary based on historical data and analyst forecasts only using an unbiased methodology and our articles are not intended to be financial advice. It does not constitute a recommendation to buy or sell any stock, and does not take account of your objectives, or your financial situation. We aim to bring you long-term focused analysis driven by fundamental data. Note that our analysis may not factor in the latest price-sensitive company announcements or qualitative material. Simply Wall St has no position in any stocks mentioned.
Have feedback on this article? Concerned about the content? Get in touch with us directly. Alternatively, email editorial-team@simplywallst.com