


- Wondering if H World Group at about US$46.05 is offering good value right now, or if the stock has already priced in the key positives.
- Over the past month the share price is down 17.3%, even though the stock is still up 28.3% over the last year and 25.4% over three years.
- Recent coverage has focused on H World Group's position in the hospitality sector and how investors are reassessing travel related stocks, which helps frame these price moves. Commentary has also highlighted how sentiment can swing quickly for consumer services stocks when expectations around demand or expansion plans shift.
- H World Group currently has a valuation score of 5 out of 6. The next sections will walk through the main valuation methods used to arrive at that score, and will then finish with a broader way to think about what valuation really means for you as a shareholder.
Approach 1: H World Group Discounted Cash Flow (DCF) Analysis
A Discounted Cash Flow model takes estimates of the cash H World Group could generate in the future, then discounts those cash flows back to today to arrive at an estimate of what the stock might be worth now.
H World Group's latest twelve month free cash flow is reported at CN¥7,105.18m. Using a 2 Stage Free Cash Flow to Equity model based on analyst projections and then Simply Wall St extrapolations, future free cash flow is projected out to 2035. For example, free cash flow for 2028 is projected at CN¥9,343.08m, and the 2035 projection is CN¥13,788.36m, with each year's figure discounted back to a present value.
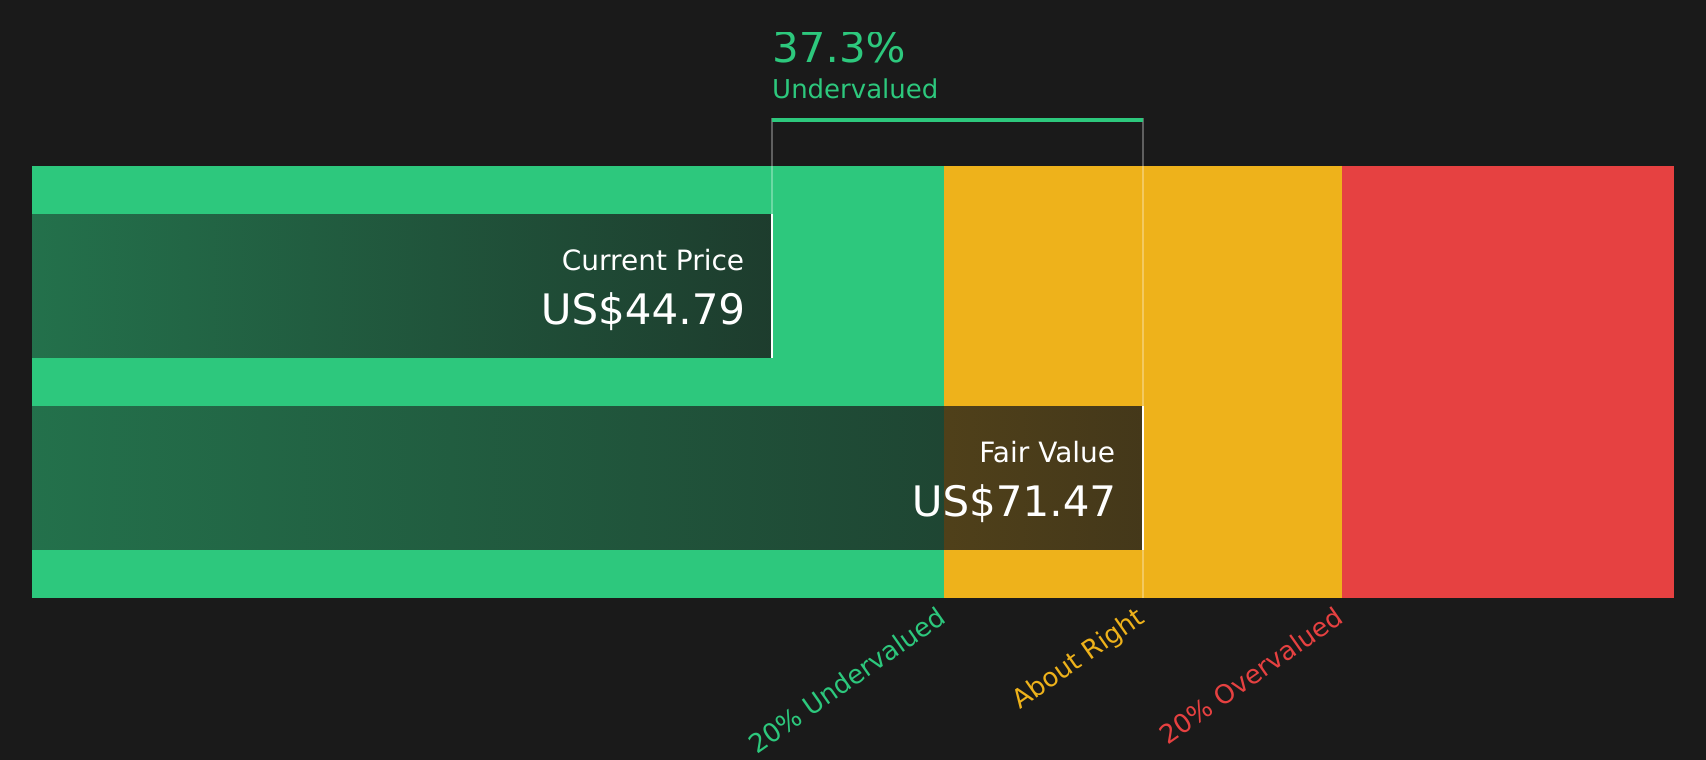
Bringing all of those discounted CN¥ cash flows together leads to an estimated intrinsic value of US$70.77 per share, compared with the current share price of about US$46.05. On this basis, the model suggests H World Group is trading at a 34.9% discount to its estimated intrinsic value, which screens as materially undervalued under these assumptions.
Result: UNDERVALUED
Our Discounted Cash Flow (DCF) analysis suggests H World Group is undervalued by 34.9%. Track this in your watchlist or portfolio, or discover 51 more high quality undervalued stocks.
Approach 2: H World Group Price vs Earnings
For a profitable company like H World Group, the P/E ratio is a useful way to think about value because it links what you pay directly to the earnings the company is already generating. A higher or lower P/E can often reflect what the market expects for future growth and how much risk investors are willing to accept for those earnings.
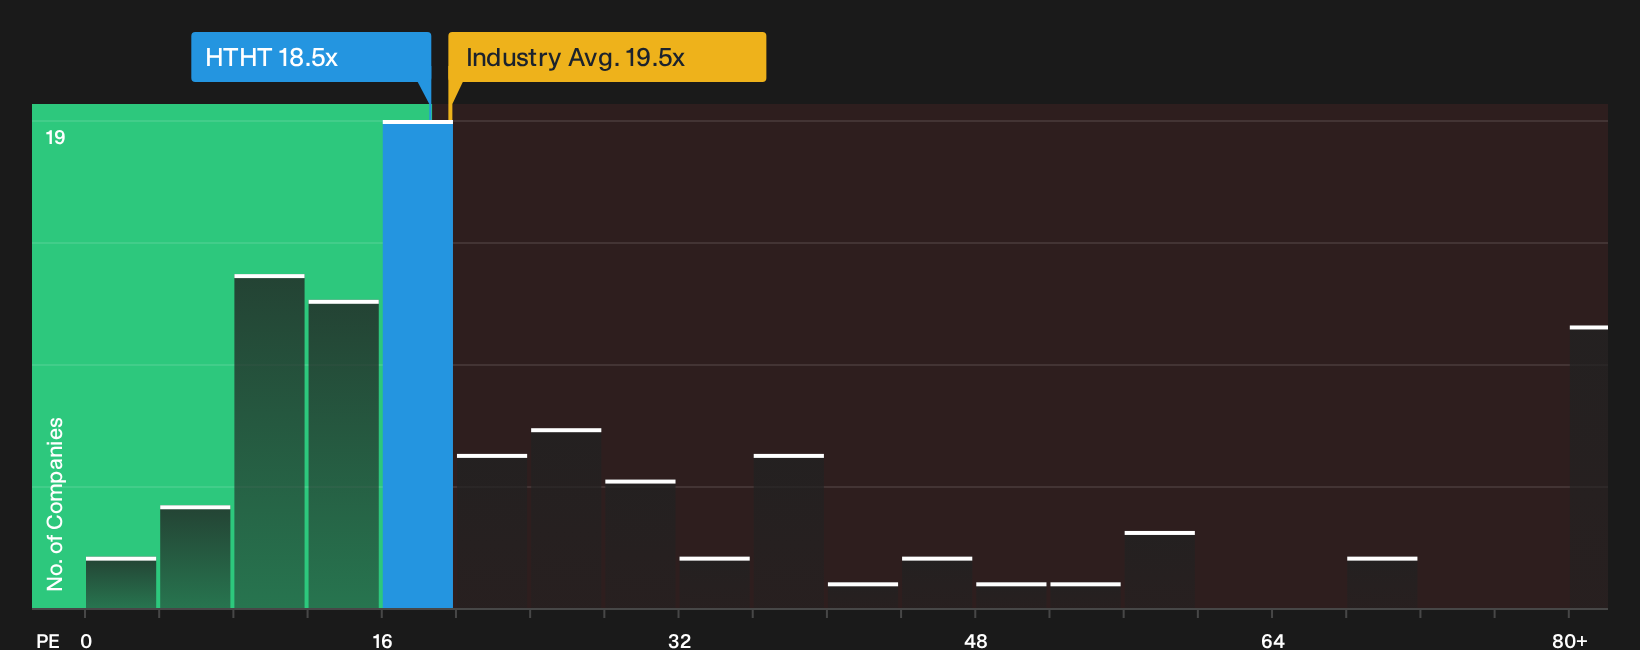
H World Group currently trades on a P/E of 19.27x. That sits close to both the Hospitality sector average of 20.01x and the peer group average of 18.01x, so on simple comparisons the stock looks broadly in line with its sector.
Simply Wall St also calculates a Fair Ratio for H World Group of 24.97x. This is a proprietary estimate of what a reasonable P/E could be, given factors such as the company’s earnings growth profile, industry, profit margins, market cap and specific risks. Because it adjusts for these company level features, the Fair Ratio aims to give a more tailored view than a basic peer or industry comparison. Since the Fair Ratio of 24.97x is higher than the current 19.27x P/E, this method suggests that the stock may be undervalued on earnings.
Result: UNDERVALUED
P/E ratios tell one story, but what if the real opportunity lies elsewhere? Start investing in legacies, not executives. Discover our 19 top founder-led companies.
Upgrade Your Decision Making: Choose your H World Group Narrative
Earlier it was mentioned that there is an even better way to understand valuation. Narratives on Simply Wall St let you attach a clear story about H World Group to the numbers you care about, by spelling out your view on future revenue, earnings and margins, linking that story to a financial forecast and fair value, then comparing that fair value with the current price to help you decide if the stock looks attractive or stretched.
You can access Narratives within the Community page, where millions of investors share these story plus numbers views. Each one updates automatically when new information such as news, earnings or guidance is added so your fair value view stays aligned with fresh data rather than static assumptions.
For H World Group, one investor might build a Narrative similar to the more optimistic fair value of about US$62.89, leaning on higher revenue growth and margin assumptions. Another might set up a more cautious Narrative closer to US$39.86, focusing on the risks around expansion. By comparing each Narrative fair value with the current share price you can decide which story feels closer to your own expectations.
For H World Group, here are previews of two leading H World Group Narratives:
Fair value in this bullish Narrative: US$60.52 per share
Implied discount to this fair value at about US$46.05: roughly 24.0%
Revenue growth assumption: 6.37% a year
- Analysts in this camp see cost controls, a higher tier hotel mix and the shift toward an asset light model as key supports for higher margins over time.
- They build in revenue growth of 6.37% a year, higher profit margins and a future P/E of 24.5x on 2029 earnings to reach a fair value around US$60.52.
- The main risks they flag include potential overexpansion in lower tier cities, pressure on RevPAR and margins from new supply and macro headwinds, and the need for ongoing investment in hotel upgrades.
Fair value in this bearish Narrative: US$39.86 per share
Implied premium to this fair value at about US$46.05: roughly 15.5%
Revenue growth assumption: 5.36% a year
- The bearish view leans heavily on the risk that adding more than 20,000 hotels across 2,000 cities could saturate some markets and hold back RevPAR and earnings.
- This camp uses softer revenue growth of 5.36% a year, a lower future P/E of 17.7x and a higher discount rate of 9.98% to arrive at a fair value around US$39.86.
- They also point to reliance on franchise economics, possible pressure on upper midscale pricing and more volatile leisure driven demand as reasons to treat current expectations as demanding.
Both Narratives use the same core business, with different assumptions about growth, margins and the multiple investors might be willing to pay in future. A useful step is to decide which set of assumptions feels closer to how you see H World Group, then consider whether the current price around US$46.05 sits comfortably against that view or not.
To see how these bullish and bearish storylines are built and updated, and to put your own assumptions alongside other investors, you can review the full range of community Narratives for H World Group on Simply Wall St using the narrative tools on the company page. See what the community is saying about H World Group.
Do you think there's more to the story for H World Group? Head over to our Community to see what others are saying!

This article by Simply Wall St is general in nature. We provide commentary based on historical data and analyst forecasts only using an unbiased methodology and our articles are not intended to be financial advice. It does not constitute a recommendation to buy or sell any stock, and does not take account of your objectives, or your financial situation. We aim to bring you long-term focused analysis driven by fundamental data. Note that our analysis may not factor in the latest price-sensitive company announcements or qualitative material. Simply Wall St has no position in any stocks mentioned.
Have feedback on this article? Concerned about the content? Get in touch with us directly. Alternatively, email editorial-team@simplywallst.com