


The United States market has shown a steady performance, remaining flat over the last week but achieving a 24% increase over the past year, with earnings projected to grow by 17% annually. In such an environment, identifying stocks that are priced below their estimated value can offer potential opportunities for investors seeking to capitalize on future growth prospects.
Top 10 Undervalued Stocks Based On Cash Flows In The United States
| Name | Current Price | Fair Value (Est) | Discount (Est) |
| Uranium Energy (UEC) | $13.20 | $26.26 | 49.7% |
| Travere Therapeutics (TVTX) | $42.89 | $84.14 | 49% |
| Lazard (LAZ) | $45.94 | $89.09 | 48.4% |
| Kaspi.kz (KSPI) | $88.905 | $174.39 | 49% |
| First Merchants (FRME) | $39.58 | $76.23 | 48.1% |
| FB Financial (FBK) | $52.16 | $101.61 | 48.7% |
| CVR Energy (CVI) | $34.54 | $67.53 | 48.9% |
| Coastal Financial (CCB) | $69.71 | $134.79 | 48.3% |
| Beazer Homes USA (BZH) | $21.90 | $43.29 | 49.4% |
| Ategrity Specialty Insurance Company Holdings (ASIC) | $20.56 | $40.26 | 48.9% |
Here's a peek at a few of the choices from the screener.
Cellebrite DI (CLBT)
Overview: Cellebrite DI Ltd. develops software and services for legally sanctioned investigations across various regions including Europe, the Middle East, Africa, the Americas, and the Asia-Pacific, with a market cap of $3.24 billion.
Operations: The company generates $496.43 million in revenue from its Internet Software & Services segment.
Estimated Discount To Fair Value: 20%
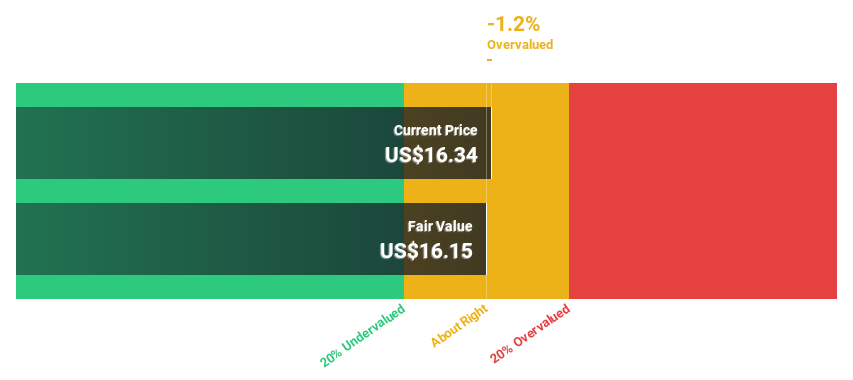
Cellebrite DI is trading at US$13.63, below its estimated future cash flow value of US$17.03, suggesting it may be undervalued based on cash flows. Its earnings are forecast to grow significantly at 21% annually, outpacing the broader U.S. market's growth rate. However, recent earnings show a decline in net income despite revenue growth to US$128.3 million from US$107.55 million year-on-year, highlighting potential profitability challenges amid robust revenue forecasts and strategic product advancements like FedRAMP High Authorization for its Government Cloud platform.
- Upon reviewing our latest growth report, Cellebrite DI's projected financial performance appears quite optimistic.
- Unlock comprehensive insights into our analysis of Cellebrite DI stock in this financial health report.
Dutch Bros (BROS)
Overview: Dutch Bros Inc., along with its subsidiaries, operates and franchises drive-thru coffee shops across the United States, with a market cap of approximately $9.57 billion.
Operations: The company's revenue primarily comes from its company-operated shops, generating $1.61 billion, with an additional $135.45 million from franchising and other activities.
Estimated Discount To Fair Value: 31.3%
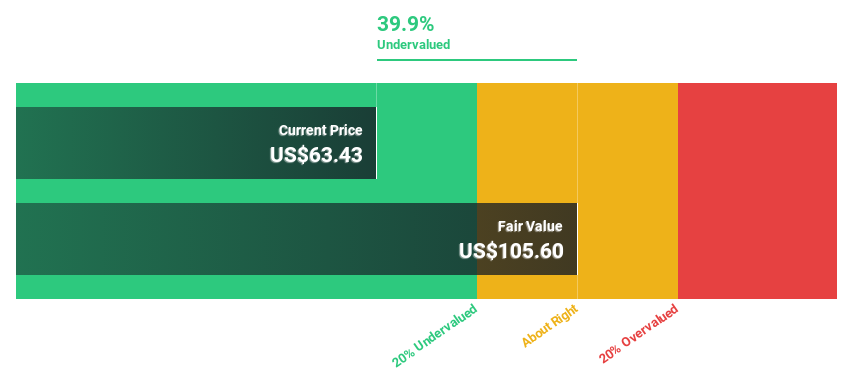
Dutch Bros is trading at US$52.74, below its estimated future cash flow value of US$76.8, indicating potential undervaluation based on cash flows. Earnings are projected to grow significantly at 26.4% annually, surpassing the U.S. market's growth rate. Despite slower revenue growth compared to earnings, recent expansions in Chicago and raised revenue guidance between US$2.05 billion and US$2.08 billion for 2026 highlight strategic positioning for profitability improvements amidst expanding market presence.
- The analysis detailed in our Dutch Bros growth report hints at robust future financial performance.
- Click here to discover the nuances of Dutch Bros with our detailed financial health report.
T1 Energy (TE)
Overview: T1 Energy Inc. offers energy solutions focusing on solar modules and cells across the United States, Norway, and internationally, with a market cap of $1.58 billion.
Operations: The company's revenue is primarily derived from the development of lithium-ion batteries, amounting to $879.49 million.
Estimated Discount To Fair Value: 43.2%
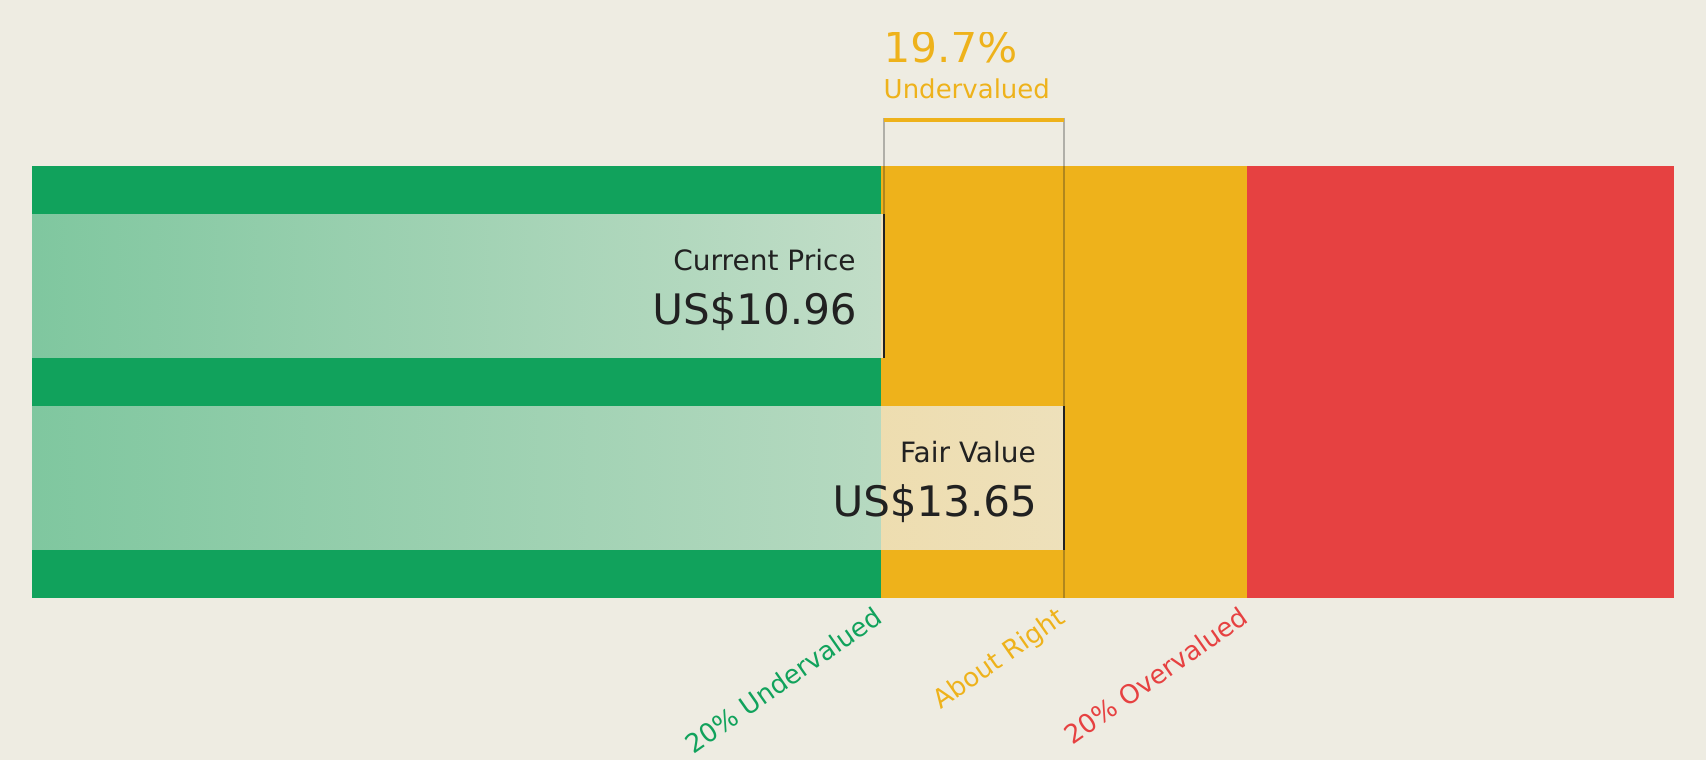
T1 Energy, trading at US$7, is below its estimated future cash flow value of US$12.33, highlighting potential undervaluation. Despite a net loss of US$20.42 million in Q1 2026, revenue surged to US$177.65 million from the previous year. The company maintains a production guidance of 3.1 GW–4.2 GW for 2026 and anticipates profitability within three years with forecasted annual earnings growth of 93.2%, outpacing industry averages despite recent shareholder dilution and volatility concerns.
- In light of our recent growth report, it seems possible that T1 Energy's financial performance will exceed current levels.
- Click to explore a detailed breakdown of our findings in T1 Energy's balance sheet health report.
Turning Ideas Into Actions
- Click through to start exploring the rest of the 144 Undervalued US Stocks Based On Cash Flows now.
- Are you invested in these stocks already? Keep abreast of every twist and turn by setting up a portfolio with Simply Wall St, where we make it simple for investors like you to stay informed and proactive.
- Invest smarter with the free Simply Wall St app providing detailed insights into every stock market around the globe.
Want To Explore Some Alternatives?
- Explore high-performing small cap companies that haven't yet garnered significant analyst attention.
- Diversify your portfolio with solid dividend payers offering reliable income streams to weather potential market turbulence.
- Fuel your portfolio with companies showing strong growth potential, backed by optimistic outlooks both from analysts and management.
This article by Simply Wall St is general in nature. We provide commentary based on historical data and analyst forecasts only using an unbiased methodology and our articles are not intended to be financial advice. It does not constitute a recommendation to buy or sell any stock, and does not take account of your objectives, or your financial situation. We aim to bring you long-term focused analysis driven by fundamental data. Note that our analysis may not factor in the latest price-sensitive company announcements or qualitative material. Simply Wall St has no position in any stocks mentioned.
Have feedback on this article? Concerned about the content? Get in touch with us directly. Alternatively, email editorial-team@simplywallst.com