


- For investors considering whether Viasat at around US$75.27 offers value or reflects stretched expectations, this article examines what the recent share price suggests about the stock and what might still be missing from the picture.
- The stock has seen sharp moves recently, with a 6.6% return over the past week, 17.5% over the past month, 100.0% year to date, and a very large 1 year return of 651.9%.
- These price swings sit against a backdrop of ongoing interest in satellite connectivity and communications services. Contract wins, technology deployments, regulatory developments, and sector sentiment can all quickly reset expectations. For Viasat, recent headlines around its role in providing satellite based connectivity and broader discussions about communications infrastructure have helped keep investor attention on the stock.
- On Simply Wall St's valuation checks, Viasat currently scores 4/6. This raises some fair questions about how different methods value the stock today and how investors can go one step further to understand the bigger picture of what that number really means.
Approach 1: Viasat Discounted Cash Flow (DCF) Analysis
A Discounted Cash Flow model takes projected future cash flows, then discounts them back to today using a required rate of return to estimate what the business might be worth right now.
For Viasat, the model used is a 2 Stage Free Cash Flow to Equity approach, based on the company’s latest twelve month Free Cash Flow of about $289.7 million. Analysts supply explicit forecasts for the early years, and Simply Wall St extrapolates further cash flows out to 2035, with projected Free Cash Flow for 2028 of $555.2 million and discounted values provided for each year.
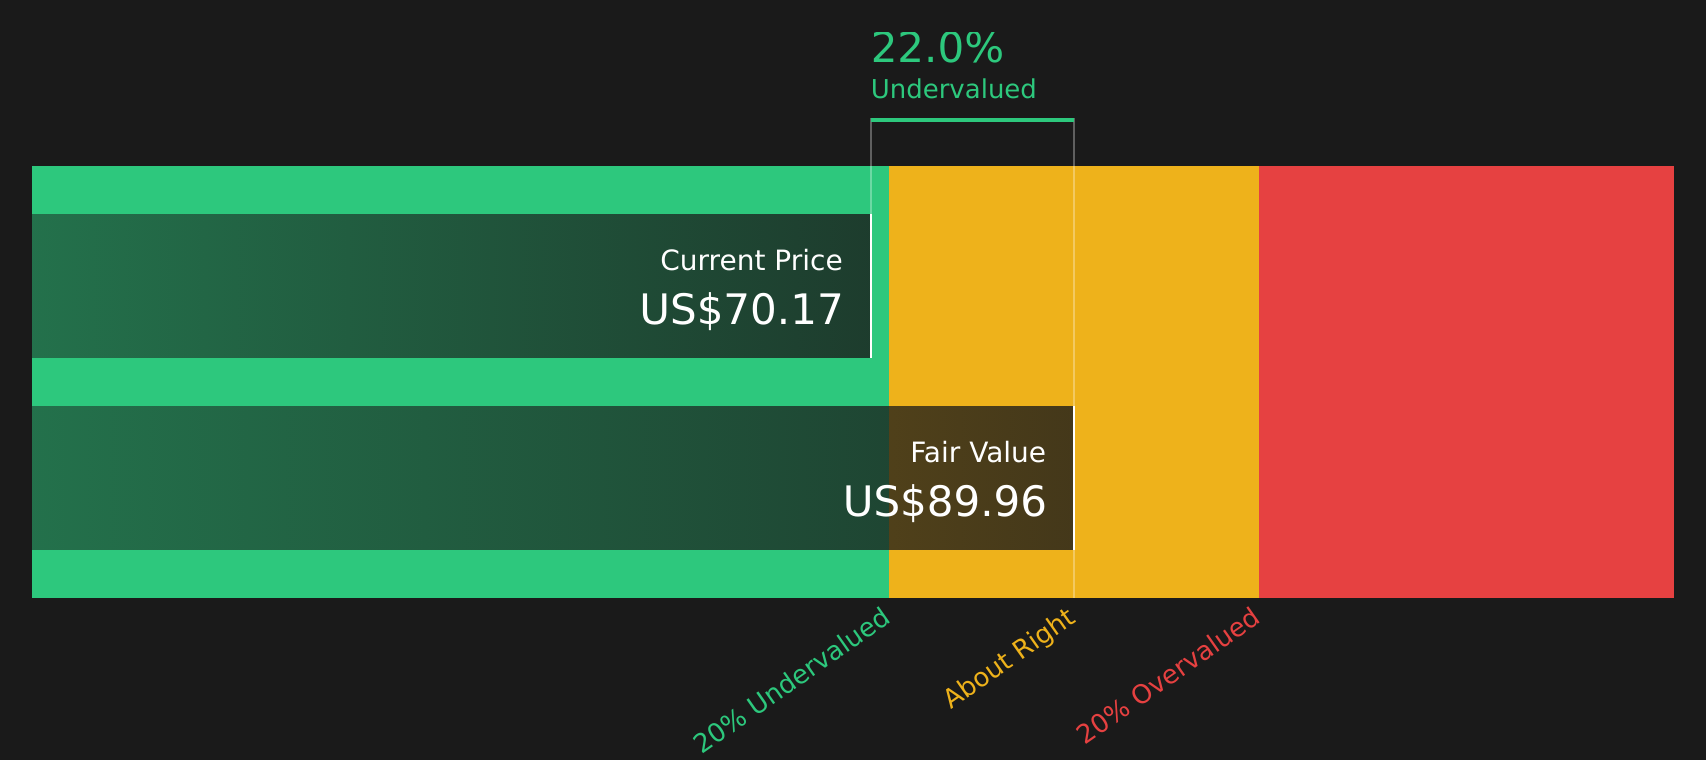
On this basis, the DCF model arrives at an estimated intrinsic value of about $75.84 per share, very close to the recent share price of around $75.27. That implies the stock screens as roughly 0.7% undervalued, which is a very small gap and well within the sort of margin where model assumptions can easily tip the result either way.
Result: ABOUT RIGHT
Viasat is fairly valued according to our Discounted Cash Flow (DCF), but this can change at a moment's notice. Track the value in your watchlist or portfolio and be alerted on when to act.
Approach 2: Viasat Price vs Sales
For companies where earnings can be uneven or where reinvestment is heavy, the Price to Sales, or P/S, ratio is often a useful way to compare what investors are paying for each dollar of revenue. It sidesteps short term earnings swings and focuses on the top line of the business.
Growth expectations and risk still matter here, because faster growing or lower risk companies often justify a higher "normal" P/S multiple, while slower or higher risk companies tend to sit on lower multiples. Viasat currently trades on a P/S ratio of 2.21x, compared with the Communications industry average of 2.45x and a peer group average of 13.20x.
Simply Wall St’s Fair Ratio for Viasat is 2.56x. This is a proprietary estimate of what the P/S multiple might reasonably be, after accounting for factors such as earnings growth, profit margins, industry, market cap and key risks. Because it adjusts for these company specific features, the Fair Ratio can give a more tailored reference point than a simple comparison with peers or the broad industry.
With Viasat’s actual P/S ratio of 2.21x sitting below the Fair Ratio of 2.56x, the stock currently screens as undervalued on this metric.
Result: UNDERVALUED

P/S ratios tell one story, but what if the real opportunity lies elsewhere? Start investing in legacies, not executives. Discover our 20 top founder-led companies.
Upgrade Your Decision Making: Choose your Viasat Narrative
Earlier it was mentioned that there is an even better way to understand valuation, so meet Narratives, a simple tool on Simply Wall St's Community page that lets you attach a clear story about Viasat to your numbers. You can link your view of its business, a financial forecast for revenue, earnings and margins, and the fair value you think is reasonable. You can then compare that fair value with the current share price to decide whether the stock looks attractive or stretched. An added benefit is that your Narrative automatically refreshes when new news or earnings arrive. For example, one investor might build a more optimistic Viasat Narrative that lines up with the higher analyst fair value around US$92.64, while another might build a more cautious Narrative closer to US$48.00. You can see both side by side to decide which story you find more compelling.
For Viasat however we will make it really easy for you with previews of two leading Viasat Narratives:
Fair value in this bullish narrative: US$92.64 per share
Gap vs current price of US$75.27: the stock would screen as about 18.8% below this fair value if those assumptions play out
Revenue growth assumption: 3.34% a year
- Backs the idea that Viasat’s MSS spectrum position, ViaSat 3 rollout, and open network approach could support a larger addressable market and higher free cash flow over time.
- Builds in a path for margins to move from current loss making levels toward the broader US Communications industry average, with earnings and EPS rising as capital intensity eases.
- Flags real risks around LEO competition, high CapEx, leverage and Inmarsat integration, so the upside case depends on solid execution and healthy satellite utilization.
Fair value in this more cautious narrative: US$51.14 per share
Gap vs current price of US$75.27: the stock would screen as about 47.8% above this fair value if those assumptions play out
Revenue growth assumption: 3.33% a year
- Accepts that demand for secure connectivity and hybrid satellite or terrestrial networks supports revenue, but questions how much of that is already in the price once heavy investment is factored in.
- Highlights pressure from high CapEx, leverage, subscriber declines in US fixed broadband and intense competition from other satellite operators that could weigh on margins and free cash flow.
- Uses an analyst consensus price target that assumes earnings and margins improve, yet still lands well below the recent share price, framing Viasat as vulnerable if execution or growth fall short.
If you want to see how other investors are joining the dots between these types of assumptions, risks and valuation markers, it is worth looking at what the wider community is saying about Viasat through Narratives, then stress testing those views against your own expectations for the business.
See what the community is saying about Viasat
Do you think there's more to the story for Viasat? Head over to our Community to see what others are saying!

This article by Simply Wall St is general in nature. We provide commentary based on historical data and analyst forecasts only using an unbiased methodology and our articles are not intended to be financial advice. It does not constitute a recommendation to buy or sell any stock, and does not take account of your objectives, or your financial situation. We aim to bring you long-term focused analysis driven by fundamental data. Note that our analysis may not factor in the latest price-sensitive company announcements or qualitative material. Simply Wall St has no position in any stocks mentioned.
Have feedback on this article? Concerned about the content? Get in touch with us directly. Alternatively, email editorial-team@simplywallst.com