


What AMETEK’s Board Change Could Mean for Investors
AMETEK (AME) recently appointed former Hexcel chief executive Nick L. Stanage to its board. This is a routine governance move that still gives you another data point when weighing the stock’s recent outperformance and cash generation.
See our latest analysis for AMETEK.
AMETEK’s share price has eased in the short term, with a 7 day share price return of negative 3.9% and a 30 day share price return of negative 4.4%. However, the 1 year total shareholder return of 25.8% and 5 year total shareholder return of 71.6% point to momentum that has been stronger over longer periods.
If you are comparing AMETEK with other industrial technology opportunities, it can help to widen your search beyond a single stock and review 34 robotics and automation stocks
With AMETEK’s shares easing in the short term but showing solid multi year gains and analysts’ targets sitting above the current US$223.17 price, you have to ask: is there still a buying opportunity here, or is future growth already fully priced in?
Most Popular Narrative: 13.9% Undervalued
Compared with the last close at $223.17, the most followed narrative points to a fair value of $259.16, framing AMETEK as modestly undervalued on its modeled cash generation and earnings path.
Adoption of digital reality, automation, and advanced metrology solutions is accelerating across key end markets such as aerospace, defense, and architecture, recently reinforced by the FARO Technologies acquisition. This expands AMETEK's addressable market and supports both revenue and margin growth through higher value, software-enabled recurring revenue streams.
Want to see what is baked into that valuation gap? The narrative leans on steady top line expansion, firmer margins, and a richer future earnings multiple. Curious which exact growth and profitability assumptions sit underneath that fair value and how they stack up against current analyst forecasts?
Result: Fair Value of $259.16 (UNDERVALUED)
Have a read of the narrative in full and understand what's behind the forecasts.
However, this depends on key assumptions, and a sharper slowdown in process or semiconductor demand, or any misstep integrating acquisitions, could quickly challenge that undervaluation story.
Find out about the key risks to this AMETEK narrative.
Another View: Cash Flows Paint a Tougher Picture
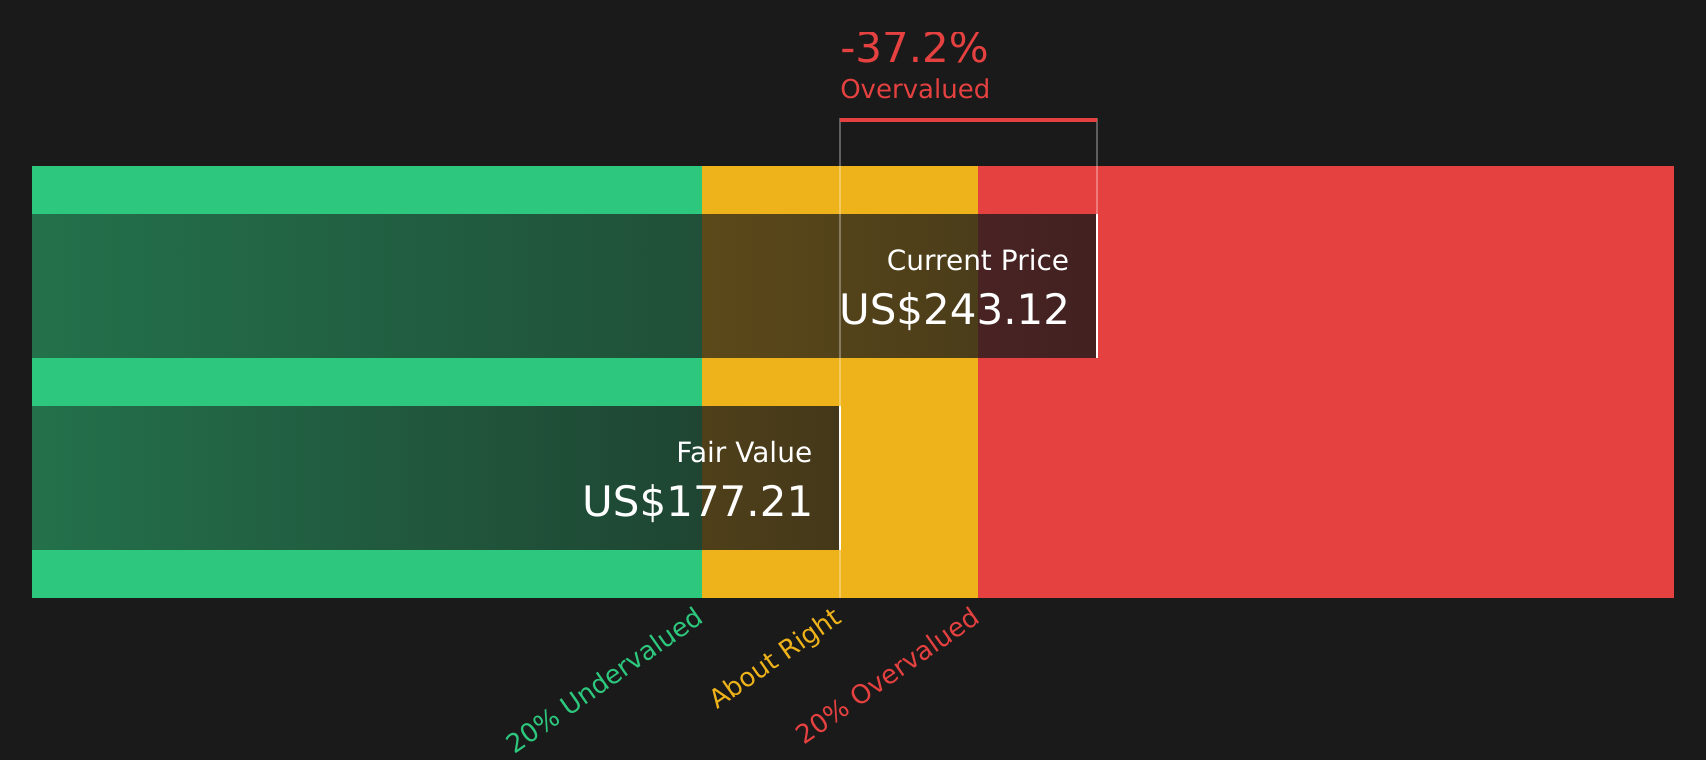
The analyst narrative points to a fair value of $259.16, but our DCF model comes out closer to $152.60. This would frame AMETEK as expensive on a cash flow basis rather than 13.9% undervalued. So which signal do you trust more: the story or the spreadsheet?
Look into how the SWS DCF model arrives at its fair value.
Simply Wall St performs a discounted cash flow (DCF) on every stock in the world every day (check out AMETEK for example). We show the entire calculation in full. You can track the result in your watchlist or portfolio and be alerted when this changes, or use our stock screener to discover 53 high quality undervalued stocks. If you save a screener we even alert you when new companies match - so you never miss a potential opportunity.
Next Steps
With mixed signals on value and sentiment, do you agree with the market’s optimism or see more risk creeping in? Take a closer look at the positives investors are focused on by reviewing the 3 key rewards.
Ready to Hunt for Your Next Investment Idea?
If AMETEK has caught your attention, do not stop there. Use the screener to line up more candidates so your next move is based on options, not guesswork.
- Target potential value opportunities by scanning 53 high quality undervalued stocks that pair quality fundamentals with appealing price tags.
- Prioritise staying power by checking solid balance sheet and fundamentals stocks screener (46 results) that focus on financial strength and balance sheet resilience.
- Spot fresh opportunities early by reviewing the screener containing 20 high quality undiscovered gems before other investors start paying attention.
This article by Simply Wall St is general in nature. We provide commentary based on historical data and analyst forecasts only using an unbiased methodology and our articles are not intended to be financial advice. It does not constitute a recommendation to buy or sell any stock, and does not take account of your objectives, or your financial situation. We aim to bring you long-term focused analysis driven by fundamental data. Note that our analysis may not factor in the latest price-sensitive company announcements or qualitative material. Simply Wall St has no position in any stocks mentioned.
Have feedback on this article? Concerned about the content? Get in touch with us directly. Alternatively, email editorial-team@simplywallst.com