


American Airlines Group (AAL) has drawn fresh attention as its stock has moved sharply in recent trading, with returns over the past week, month, and past 3 months standing out against its year-to-date performance.
See our latest analysis for American Airlines Group.
The recent 1 day share price return of 7.18% and 7 day share price return of 23.09% sit against a year to date share price decline of 4.10%. At the same time, the 1 year total shareholder return of 27.53% suggests momentum has recently strengthened from a low base.
If you are looking beyond airlines for what is moving next, this could be a useful moment to broaden your search and check out 20 top founder-led companies
So with American Airlines trading near its analyst price target and an estimated intrinsic discount of about 18%, should you see current levels as a potential entry point, or assume the market is already pricing in future growth?
Most Popular Narrative: 39.9% Overvalued
At a last close of $14.85, the most followed narrative on American Airlines pegs fair value nearer $10.61, creating a wide valuation gap to current trading.
There's a single reason why American is the least attractive of US legacy carriers (in terms of investing, anyway): its balance sheet. If most airlines and certainly those in the US are loaded up to the hilt with debt, American goes so far as to boast negative equity, any startup would go belly-up with a balance sheet such as this one. Now, you can survive and even generate decent returns with a precarious capital structure, but of course you're super-sensitive to any shock on the demand side of your business, hitting both revenues and margins, and that is where the clouds gather on American. After the industry's recent warnings regarding falling travel demand, the already cut-throat competition for market share will get yet more intensive, while margins will inevitably come under pressure. I fail to see why American might be an attractive investment proposition outside of the rosiest of economic outlooks, which is not what's at hand right now.
Want the full story behind that lower fair value? The narrative leans on specific assumptions for revenue growth, thin margins and a future profit multiple that might surprise you.
According to PittTheYounger, the current narrative applies a discount rate of 13% and pairs modest long term revenue growth expectations with relatively slim profit margins, which puts pressure on the valuation even before factoring in balance sheet concerns. The result is a fair value estimate of $10.61 against the recent $14.85 share price and a stated discount to fair value of 39.9% in this framework.
Result: Fair Value of $10.61 (OVERVALUED)
Have a read of the narrative in full and understand what's behind the forecasts.
However, shifts in travel demand or easier refinancing terms could reduce balance sheet stress and challenge assumptions around thin long term margins and valuation pressure.
Find out about the key risks to this American Airlines Group narrative.
Another View: Cash Flows Point to Undervaluation
While the popular narrative suggests American Airlines is overvalued at around $14.85, our DCF model points in the opposite direction. On these cash flow assumptions, fair value sits closer to $18.09, which frames the current price as roughly 17.9% below that estimate.
This second lens puts the focus on future cash generation rather than earnings multiples. It suggests the market could be placing a heavier weight on balance sheet risk than on recovery potential. As an investor, which set of assumptions do you find more convincing?
Look into how the SWS DCF model arrives at its fair value.
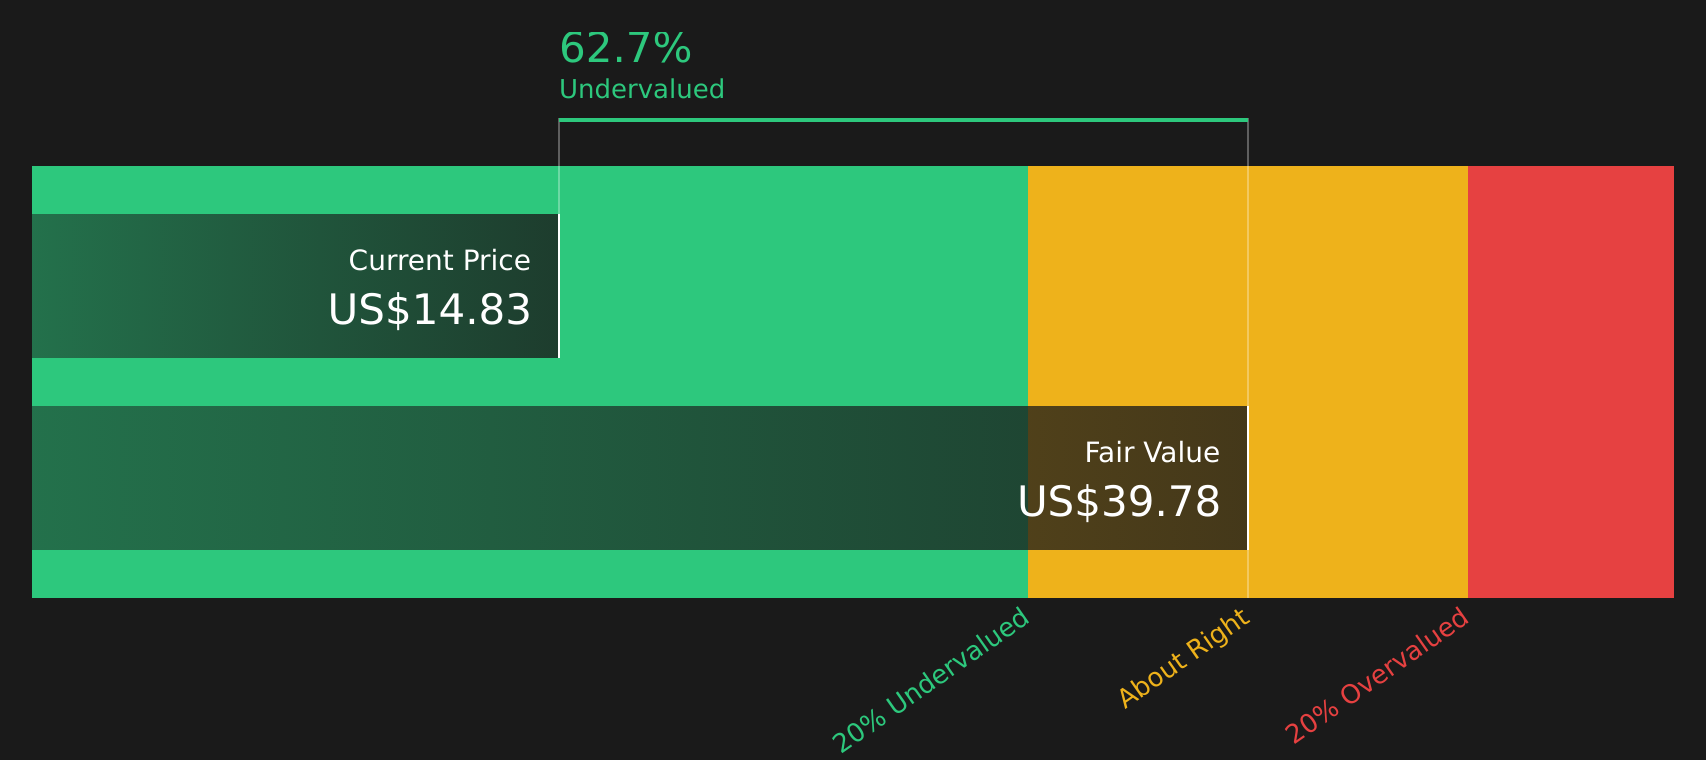
Simply Wall St performs a discounted cash flow (DCF) on every stock in the world every day (check out American Airlines Group for example). We show the entire calculation in full. You can track the result in your watchlist or portfolio and be alerted when this changes, or use our stock screener to discover 46 high quality undervalued stocks. If you save a screener we even alert you when new companies match - so you never miss a potential opportunity.
Next Steps
Feeling uncertain after seeing how split the narratives are around American Airlines? Check the underlying data now, weigh both sides carefully, and use the 2 key rewards and 4 important warning signs.
Looking for more investment ideas?
If American Airlines has sharpened your focus on risk and reward, do not stop here. Broaden your watchlist with other angles that could suit your goals.
- Target resilient balance sheets by checking companies in the solid balance sheet and fundamentals stocks screener (46 results).
- Hunt for potential mispricings by scanning the 46 high quality undervalued stocks.
- Spot under-the-radar opportunities before others by reviewing the screener containing 22 high quality undiscovered gems.
This article by Simply Wall St is general in nature. We provide commentary based on historical data and analyst forecasts only using an unbiased methodology and our articles are not intended to be financial advice. It does not constitute a recommendation to buy or sell any stock, and does not take account of your objectives, or your financial situation. We aim to bring you long-term focused analysis driven by fundamental data. Note that our analysis may not factor in the latest price-sensitive company announcements or qualitative material. Simply Wall St has no position in any stocks mentioned.
Have feedback on this article? Concerned about the content? Get in touch with us directly. Alternatively, email editorial-team@simplywallst.com