


Recent performance snapshot for Q2 Holdings (QTWO)
Q2 Holdings (QTWO) has drawn investor attention after recent trading left the stock at US$48.88, with the price down about 30% year to date and about 45% over the past year.
Those moves contrast with a roughly 70% total return over the past 3 years, which highlights how volatile the ride has been for anyone holding the stock through different market cycles.
See our latest analysis for Q2 Holdings.
Recent trading has been choppy, with a 7.02% share price decline over the last session and a 7.62% gain over the past week. The year to date share price return is down 29.6%, signalling that short term momentum is trying to recover within a weaker overall trend.
If you are weighing Q2 Holdings against other opportunities in digital finance and technology, it can help to see what else is moving in adjacent areas such as 47 AI infrastructure stocks
With Q2 Holdings trading at US$48.88, alongside an implied discount of about 50% to one analyst price target and an intrinsic value estimate, investors may need to consider whether this represents a genuine opportunity or whether the market is already pricing in future growth.
Preferred P/E of 41.4x: Is it justified?
On a P/E basis, Q2 Holdings trades at 41.4x earnings, which sits below a peer average of 80.3x yet above both the estimated fair level and the wider US Software sector.
The P/E ratio compares the current share price to earnings per share, so it reflects how much investors are willing to pay today for each dollar of current profits. For a software platform that has only recently moved into profitability and reports high quality earnings, a higher P/E can be linked to expectations that earnings will build from this base.
Here, the 41.4x P/E is flagged as good value when compared with a peer average of 80.3x, which suggests the stock trades at a discount to similar companies. At the same time, it is described as expensive versus an estimated fair P/E of 32.5x, implying the multiple could still be ahead of where the SWS model suggests it might settle if expectations were to cool. Against the broader US Software industry average of 29.3x, the current P/E also comes through as richer, which points to higher implied growth or quality expectations than the sector overall.
Explore the SWS fair ratio for Q2 Holdings
Result: Price-to-earnings of 41.4x (OVERVALUED)
However, the recent share price declines and a P/E above both the model estimate and sector average suggest that expectations could reset quickly if growth or profitability disappoints.
Wall Street's queuing for one rocket. While SpaceX counts down to its IPO, other companies tied to the new space race are already in orbit. → 20 Compelling Space Companies watchlist · Global Space Race Investing Ideas screener · Scan the sector by valuation on Rocket Lab's valuation page.
Another view: cash flow points the other way
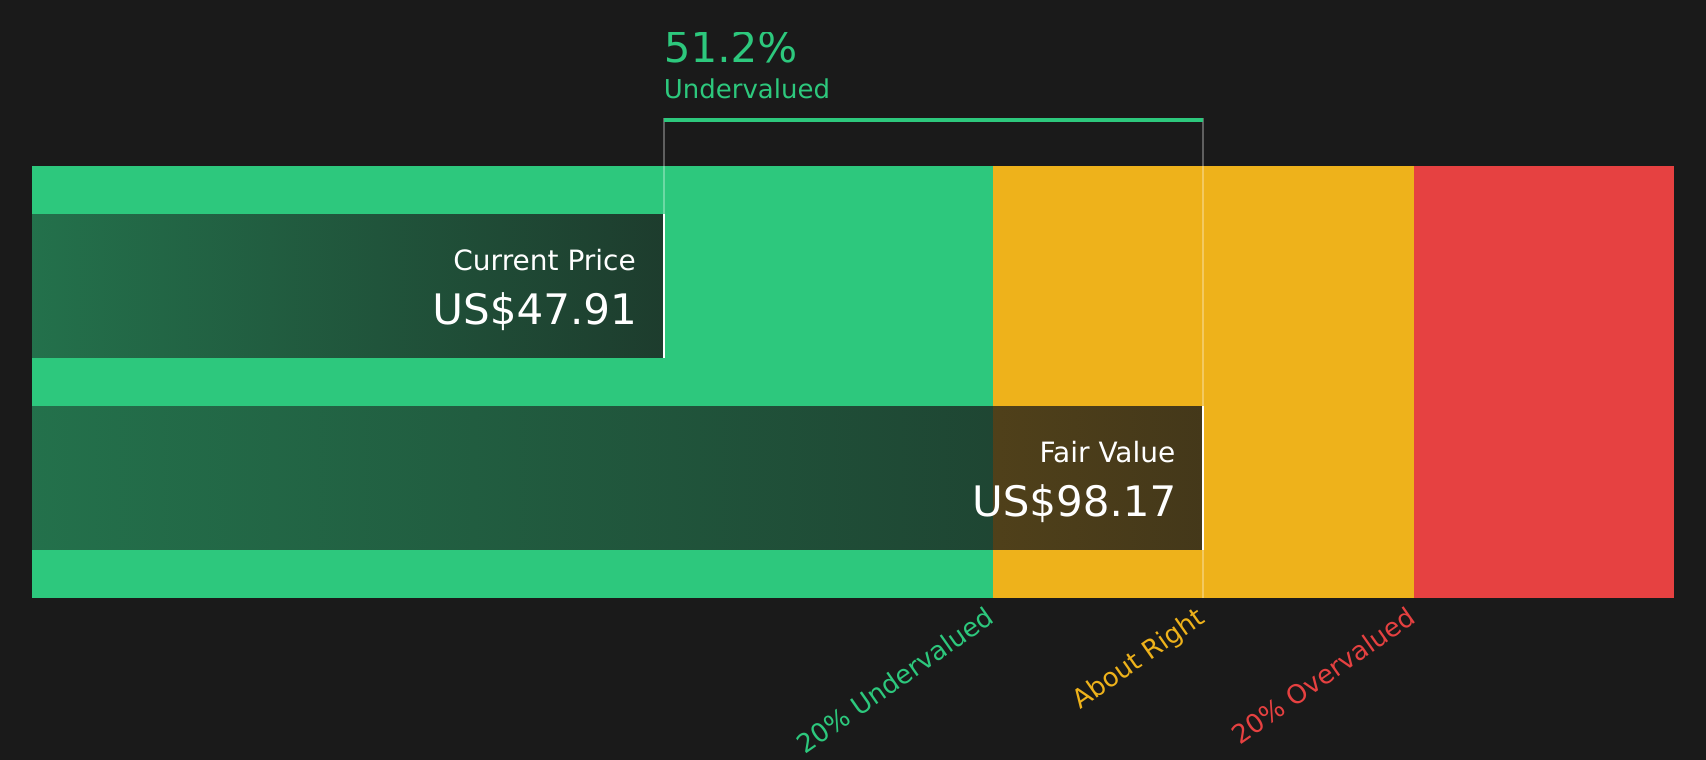
While the 41.4x P/E suggests QTWO looks expensive relative to its own fair ratio of 32.5x and the US Software industry at 29.3x, the SWS DCF model tells a different story. On that measure, Q2 Holdings at $48.88 sits well below an estimated future cash flow value of $99.03, which frames the stock as undervalued despite the richer earnings multiple. For you as an investor, the key question is which signal you trust more: current earnings or long term cash flows?
Look into how the SWS DCF model arrives at its fair value.
Simply Wall St performs a discounted cash flow (DCF) on every stock in the world every day (check out Q2 Holdings for example). We show the entire calculation in full. You can track the result in your watchlist or portfolio and be alerted when this changes, or use our stock screener to discover 46 high quality undervalued stocks. If you save a screener we even alert you when new companies match - so you never miss a potential opportunity.
Next Steps
With sentiment pulled in different directions by valuation signals and price moves, this is a moment to look at the underlying data yourself and decide how comfortable you are with the trade off between risk and potential reward, starting with 4 key rewards and 1 important warning sign.
Looking for more investment ideas?
If Q2 Holdings has your attention, do not stop here. Broaden your watchlist now so you are not relying on a single story for potential returns.
- Hunt for quality at a discount by scanning 46 high quality undervalued stocks that pair stronger fundamentals with lower implied expectations.
- Strengthen your income stream by reviewing 11 dividend fortresses that concentrate on higher yields with a focus on resilience.
- Prioritise peace of mind by checking 63 resilient stocks with low risk scores where volatility and risk scores both sit on the lower side.
This article by Simply Wall St is general in nature. We provide commentary based on historical data and analyst forecasts only using an unbiased methodology and our articles are not intended to be financial advice. It does not constitute a recommendation to buy or sell any stock, and does not take account of your objectives, or your financial situation. We aim to bring you long-term focused analysis driven by fundamental data. Note that our analysis may not factor in the latest price-sensitive company announcements or qualitative material. Simply Wall St has no position in any stocks mentioned.
Have feedback on this article? Concerned about the content? Get in touch with us directly. Alternatively, email editorial-team@simplywallst.com