


Cheniere Energy Partners (CQP) stock is drawing attention after the partnership raised its full year 2026 guidance, supported by record LNG output, higher exports, and operational improvements that lifted margins and production expectations.
See our latest analysis for Cheniere Energy Partners.
The guidance upgrade comes after a mixed run for the stock, with the share price up 14.89% year to date but down 6.99% over the past month, while 5 year total shareholder return of 106.94% points to stronger longer term compounding.
If this LNG story has your attention, it could be a good moment to look beyond CQP and check out 33 power grid technology and infrastructure stocks
With CQP trading at $62.04, slightly above the average analyst price target and flagged as having a low value score, investors have to ask whether the strong 2026 guidance is already fully reflected in the price or whether there is still a potential buying opportunity.
Price-to-Earnings of 14.5x: Is it justified?
CQP trades on a P/E of 14.5x, which sits below the broader US market but slightly above the US Oil and Gas industry average. The key question is what that gap really says about expectations embedded in the $62.04 price.
The P/E ratio compares the current share price with earnings per unit and, for an LNG export partnership like Cheniere Energy Partners, it often reflects how durable investors think current profit levels are. With earnings growing 13.6% per year over the past 5 years but only 2.8% over the last year, and margins at 18.2% compared with 21.4% previously, the current multiple appears tied to a business that has grown well over time but is not priced for rapid expansion.
Compared with the US Oil and Gas industry average P/E of 13.7x, CQP trades at a premium, which suggests the market is comfortable paying more per dollar of earnings than for the typical peer. However, relative to the estimated fair P/E of 19.1x and a peer average of 23.2x, the current 14.5x multiple is meaningfully lower. This points to a level that could shift if sentiment moved closer to those fair ratio estimates.
Explore the SWS fair ratio for Cheniere Energy Partners
Result: Price-to-Earnings of 14.5x (ABOUT RIGHT)
However, investors still face risks if LNG volumes soften or if the current premium to the US Oil and Gas industry P/E compresses toward peer levels.
Wall Street's queuing for one rocket. While SpaceX counts down to its IPO, other companies tied to the new space race are already in orbit. → 20 Compelling Space Companies watchlist · Global Space Race Investing Ideas screener · Scan the sector by valuation on Rocket Lab's valuation page.
Another angle on value: DCF sends a very different signal
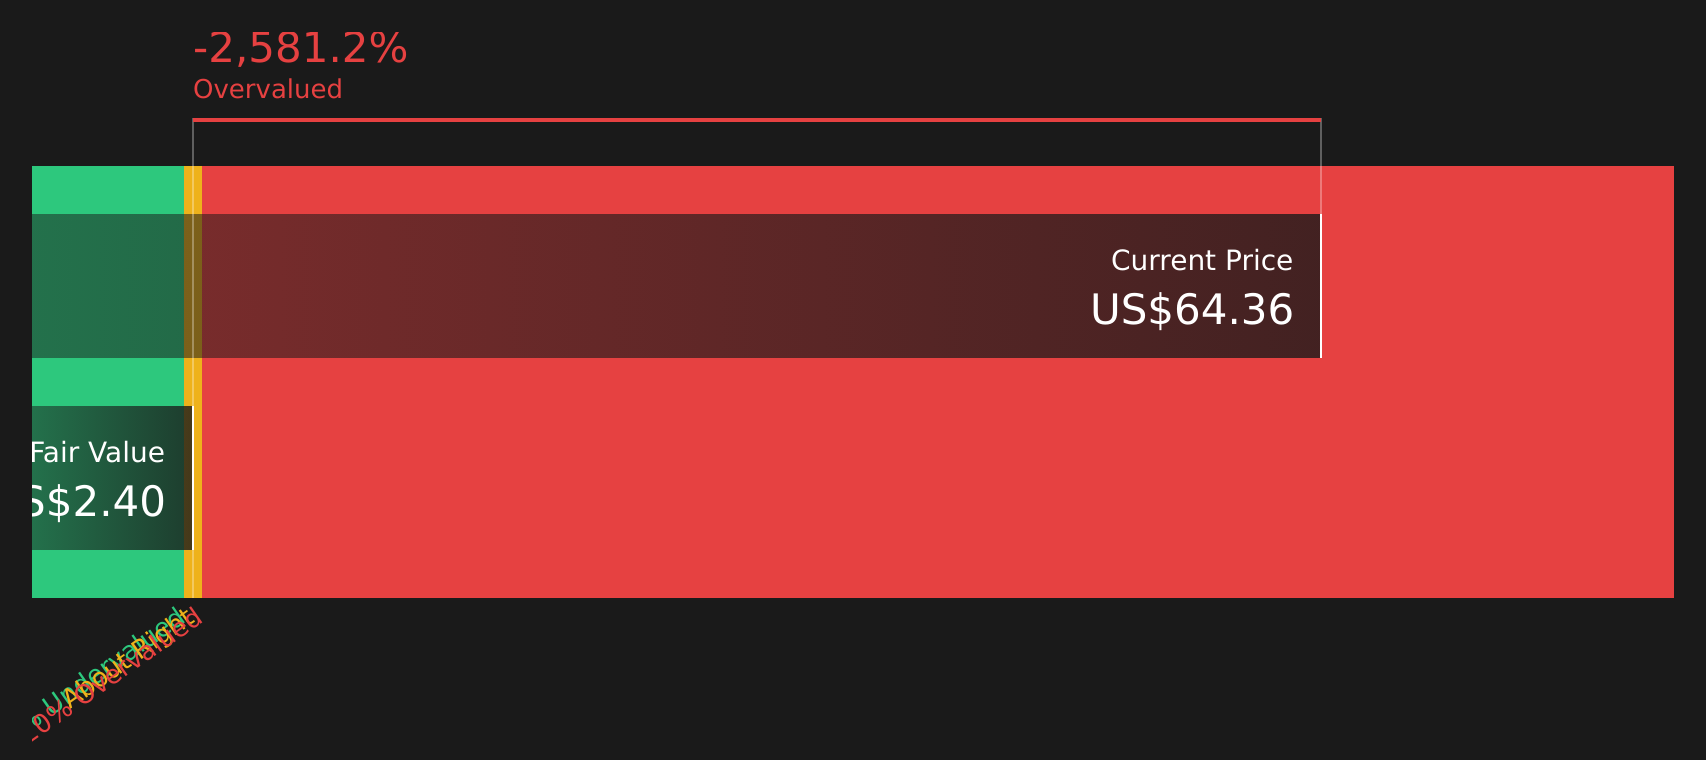
While the 14.5x P/E suggests CQP is roughly in line with the market, the SWS DCF model paints a sharper picture. On that view, CQP at $62.04 is trading well above an estimated future cash flow value of $2.40. This points to a stock that our DCF model sees as overvalued. For investors, that is a very different message to the earnings based read, and it raises a simple question: which lens do you trust more for a capital intensive LNG partnership?
Look into how the SWS DCF model arrives at its fair value.
Simply Wall St performs a discounted cash flow (DCF) on every stock in the world every day (check out Cheniere Energy Partners for example). We show the entire calculation in full. You can track the result in your watchlist or portfolio and be alerted when this changes, or use our stock screener to discover 47 high quality undervalued stocks. If you save a screener we even alert you when new companies match - so you never miss a potential opportunity.
Next Steps
If this mix of strong guidance, premium pricing, and a sharp DCF gap leaves you unsure, do not wait around for a consensus to form. Instead, check the 2 key rewards and 2 important warning signs
Looking for more investment ideas?
Do not let your research stop with one stock. Broaden your watchlist now so you are ready when the next opportunity fits your style.
- Target dependable cash generators by scanning companies on the solid balance sheet and fundamentals stocks screener (47 results).
- Hunt for quality at a sensible price by reviewing the 47 high quality undervalued stocks.
- Lock in potential income streams by checking companies in the 10 dividend fortresses.
This article by Simply Wall St is general in nature. We provide commentary based on historical data and analyst forecasts only using an unbiased methodology and our articles are not intended to be financial advice. It does not constitute a recommendation to buy or sell any stock, and does not take account of your objectives, or your financial situation. We aim to bring you long-term focused analysis driven by fundamental data. Note that our analysis may not factor in the latest price-sensitive company announcements or qualitative material. Simply Wall St has no position in any stocks mentioned.
Have feedback on this article? Concerned about the content? Get in touch with us directly. Alternatively, email editorial-team@simplywallst.com