


- If you are wondering whether NOV at around US$20.14 still offers value or if most of the opportunity is already priced in, you are asking the right question.
- The stock has returned 0.9% over the past week, is roughly flat over the last month with a 0.2% decline, and sits on a 22.7% year to date gain and 63.7% return over the past year. This naturally raises questions about how much upside or risk is now on the table.
- Recent coverage of NOV has focused on its role in the energy equipment and services space, with investors paying attention to how the business is positioned across drilling, production and related technologies. Commentary has also highlighted how sector wide themes and capital spending cycles might be influencing sentiment around the stock.
- NOV currently scores 2 out of 6 on Simply Wall St’s valuation checks. The upcoming sections will compare what different valuation approaches say about the stock’s pricing and then wrap up with a way to look beyond any single model to understand value in a more complete way.
NOV scores just 2/6 on our valuation checks. See what other red flags we found in the full valuation breakdown.
Approach 1: NOV Discounted Cash Flow (DCF) Analysis
A Discounted Cash Flow model takes estimates of a company’s future cash flows and discounts them back to today, aiming to translate those projected dollars into a single present value per share.
For NOV, the latest twelve month free cash flow is about $753.7 million. Using a 2 Stage Free Cash Flow to Equity model, analysts and extrapolated estimates point to projected free cash flow of $571.4 million in 2035, with intermediate years such as 2026 to 2030 ranging between about $387.4 million and $612.0 million. Figures beyond the explicit analyst horizon are extrapolated by Simply Wall St.
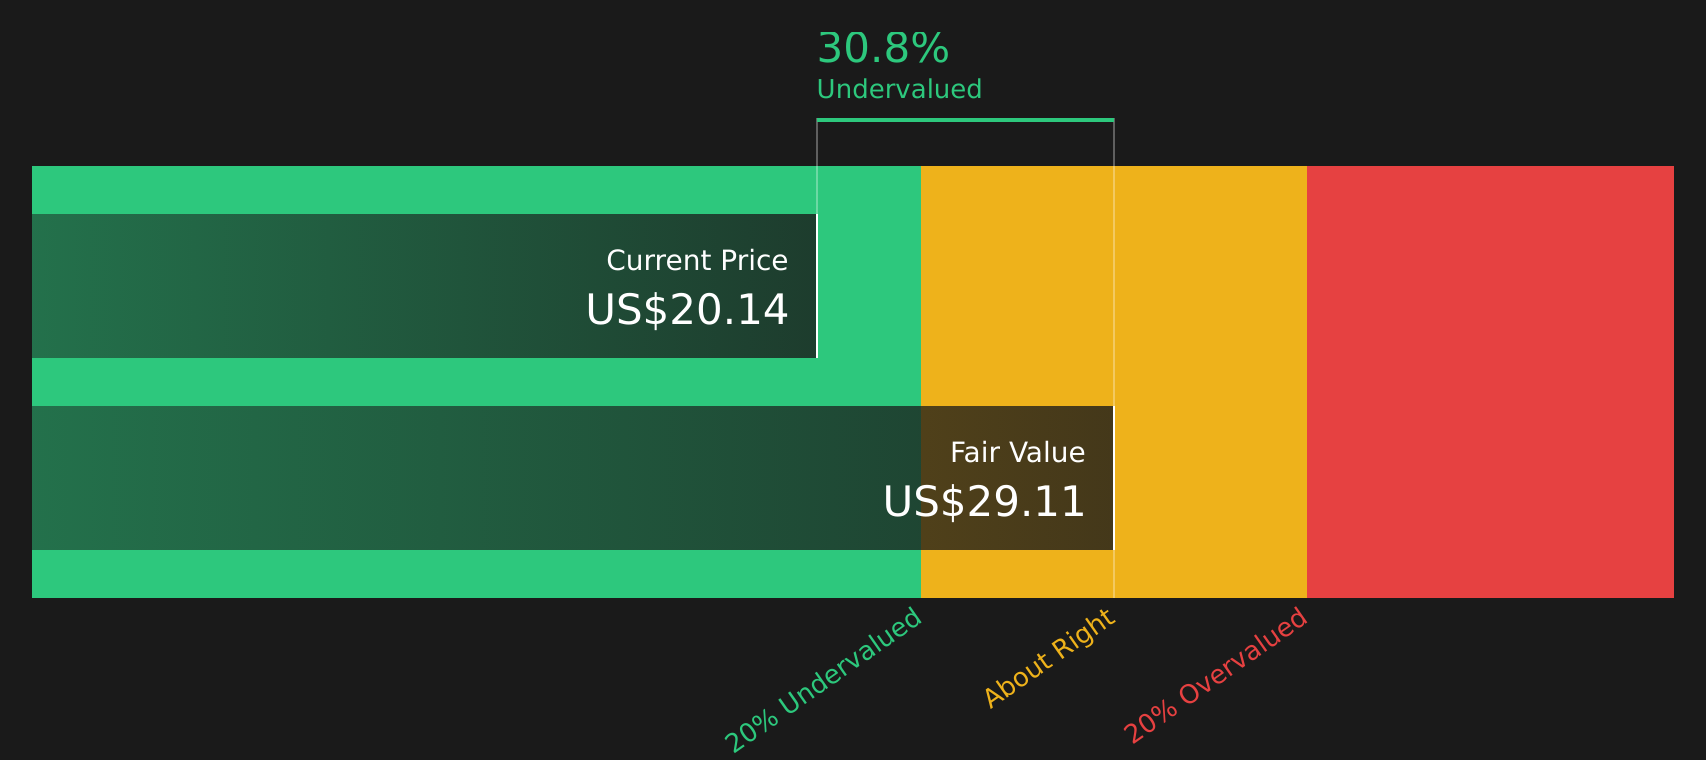
On this basis, the DCF model arrives at an estimated intrinsic value of $29.19 per share for NOV. Compared with the recent share price of about $20.14, this implies an intrinsic discount of roughly 31.0%. Under this specific cash flow approach, the stock therefore screens as undervalued.
Result: UNDERVALUED
Our Discounted Cash Flow (DCF) analysis suggests NOV is undervalued by 31.0%. Track this in your watchlist or portfolio, or discover 49 more high quality undervalued stocks.
Approach 2: NOV Price vs Earnings
For profitable companies, the P/E ratio is a straightforward way to relate what you pay for each share to the earnings that the business is currently generating. It helps you see how many dollars investors are paying for each dollar of earnings.
What counts as a “normal” P/E depends on how quickly earnings are expected to grow and how much risk investors see in those earnings. Higher expected growth or lower perceived risk can support a higher P/E, while slower growth or higher risk usually point to a lower P/E.
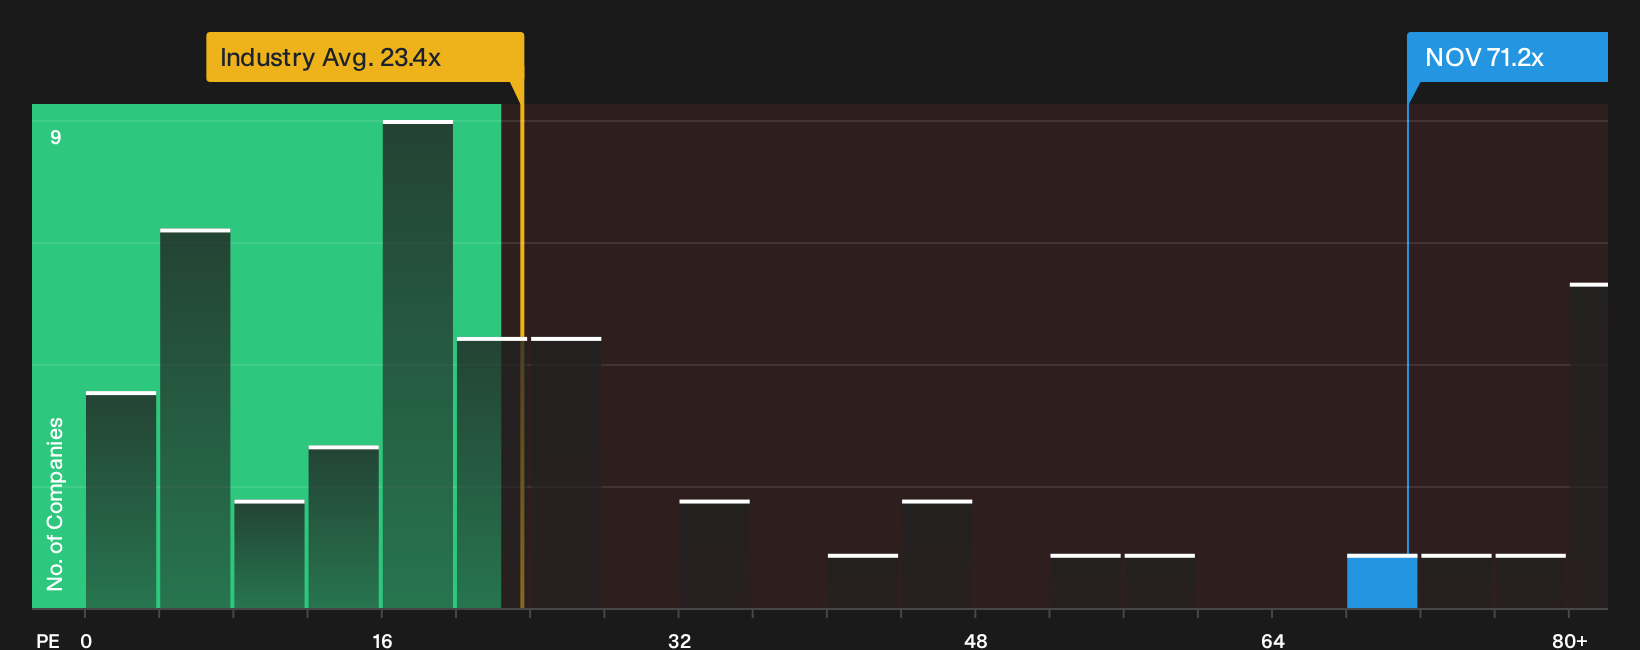
NOV currently trades on a P/E of 79.43x, compared with an Energy Services industry average of 25.54x and a peer group average of 46.43x. Simply Wall St’s Fair Ratio for NOV is 27.92x, which is its view of what a balanced P/E might look like after considering factors such as earnings growth, profit margins, industry, market cap and company specific risks.
This Fair Ratio is more tailored than a simple comparison against peers or the broad industry because it tries to line up the multiple with NOV’s own profile rather than generic group averages. Against this Fair Ratio, NOV’s current P/E looks high.
Result: OVERVALUED
Wall Street's queuing for one rocket. While SpaceX counts down to its IPO, other companies tied to the new space race are already in orbit. → 20 Compelling Space Companies watchlist · Global Space Race Investing Ideas screener · Scan the sector by valuation on Rocket Lab's valuation page.
Upgrade Your Decision Making: Choose your NOV Narrative
Earlier it was mentioned that there is an even better way to understand valuation. Narratives take center stage here as a simple way for you to attach a clear story about NOV to your own assumptions for future revenue, earnings and margins. You can link that story to a financial forecast and fair value, and then compare that fair value with the current share price on Simply Wall St’s Community page. Narratives from different investors are updated when new news or earnings appear. One investor might build a NOV Narrative around the higher fair value of US$23.00 with stronger earnings and margin expectations, while another anchors to the lower US$17.00 view with more cautious assumptions. This gives you a clear, side by side sense of how different perspectives translate into different fair values and potential decisions on when the stock looks attractive or stretched.
For NOV, however, we will make it really easy for you with previews of two leading NOV Narratives:
These give you a concise bull and bear framing so you can decide which assumptions feel closer to how you see the business and the stock.
Fair value in this narrative: US$21.40 per share
Implied pricing vs fair value: about 5.9% below that fair value at the recent US$20.14 share price
Revenue growth used in this narrative: 2.26% a year
- Assumes offshore and international oil and gas activity, LNG and broader energy infrastructure projects support steadier demand for NOV’s drilling, production and pipe technologies.
- Builds in higher margins over time from automation, digital tools, cost reductions and consolidation, with recurring software and service revenue adding support.
- Flags execution and macro risks such as tariffs, inflation, volatile orders and dependence on an offshore recovery, but overall treats the current price as close to fair for those assumptions.
Fair value in this narrative: US$17.00 per share
Implied pricing vs fair value: about 18.5% above that fair value at the recent US$20.14 share price
Revenue growth used in this narrative: 1.08% a year
- Assumes NOV stays heavily tied to traditional oil and gas, with energy transition, efficiency gains and competition putting long run pressure on orders and pricing.
- Builds in only modest revenue growth and a lower P/E multiple, with higher ESG driven capital costs and industry consolidation weighing on valuation.
- Accepts that offshore, gas infrastructure and digital offerings may help, but still treats the current price as demanding relative to these more cautious earnings and growth expectations.
If you want to see the full reasoning, the numbers behind each forecast and how other investors are framing NOV, it is worth reading the complete narratives side by side before making any decision.
To see how these results tie into long-term growth, risks, and valuation, check out the full range of community narratives for NOV on Simply Wall St. Add the company to your watchlist or portfolio so you'll be alerted when the story evolves.
Do you think there's more to the story for NOV? Head over to our Community to see what others are saying!

This article by Simply Wall St is general in nature. We provide commentary based on historical data and analyst forecasts only using an unbiased methodology and our articles are not intended to be financial advice. It does not constitute a recommendation to buy or sell any stock, and does not take account of your objectives, or your financial situation. We aim to bring you long-term focused analysis driven by fundamental data. Note that our analysis may not factor in the latest price-sensitive company announcements or qualitative material. Simply Wall St has no position in any stocks mentioned.
Have feedback on this article? Concerned about the content? Get in touch with us directly. Alternatively, email editorial-team@simplywallst.com