


- If you are wondering whether Waste Management stock is priced fairly or carrying a premium, it helps to start by looking at how its recent returns line up with what you are paying today.
- The share price last closed at US$224.28, with returns of 2.9% over the past week, 4.7% over the past month, 2.7% year to date, and a decline of 2.7% over the past year, compared with much stronger gains over 3 and 5 years.
- Recent headlines around Waste Management have focused on its role as a core US waste services provider and an established dividend payer. These themes tend to attract investors looking for stability. At the same time, ongoing attention on regulated waste services and infrastructure spending has kept the stock on many investors’ watchlists, even when the short term share price has cooled.
- Simply Wall St currently gives Waste Management a valuation score of 2 out of 6. The next sections will walk through how different valuation methods, and a more narrative driven view at the end, can help you judge whether that score fits your own expectations.
Waste Management scores just 2/6 on our valuation checks. See what other red flags we found in the full valuation breakdown.
Approach 1: Waste Management Discounted Cash Flow (DCF) Analysis
A Discounted Cash Flow, or DCF, model estimates what a stock could be worth by projecting future cash flows and discounting them back to today using a required rate of return. It focuses on the cash the company is expected to generate for shareholders over time.
For Waste Management, the latest twelve month free cash flow is about $2.9b. Analyst inputs and Simply Wall St projections point to free cash flow of $4.5b in 2030, with a 2 Stage Free Cash Flow to Equity model extending estimates out to 2035. Early years use analyst forecasts up to 5 years, and later years are extrapolated from those inputs.
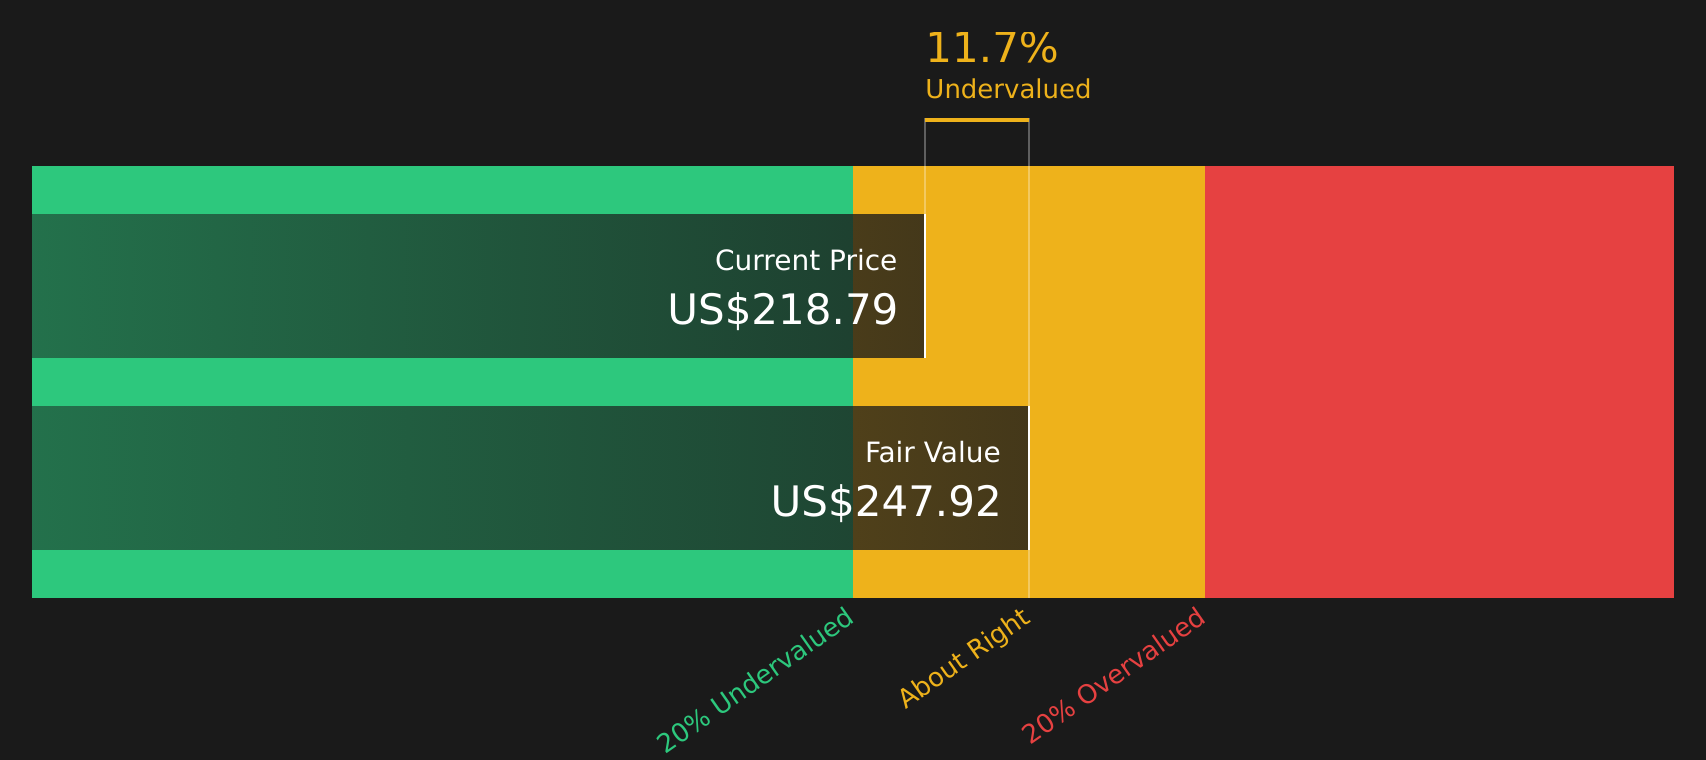
On this basis, the DCF model arrives at an estimated intrinsic value of about $247.27 per share. Compared with the recent share price of $224.28, this implies an intrinsic discount of roughly 9.3%, which is a relatively small gap and suggests the stock is trading close to the model’s estimate of fair value.
Result: ABOUT RIGHT
Waste Management is fairly valued according to our Discounted Cash Flow (DCF), but this can change at a moment's notice. Track the value in your watchlist or portfolio and be alerted on when to act.
Approach 2: Waste Management Price vs Earnings (P/E)
For profitable companies, the P/E ratio is a useful way to link what you pay for the stock to the earnings it generates today. It lets you quickly compare how many dollars investors are paying for each dollar of current earnings.
What counts as a “normal” P/E depends on how quickly earnings are expected to grow and how risky those earnings are. Higher expected growth or lower perceived risk can support a higher multiple, while slower growth or higher risk usually points to a lower one.
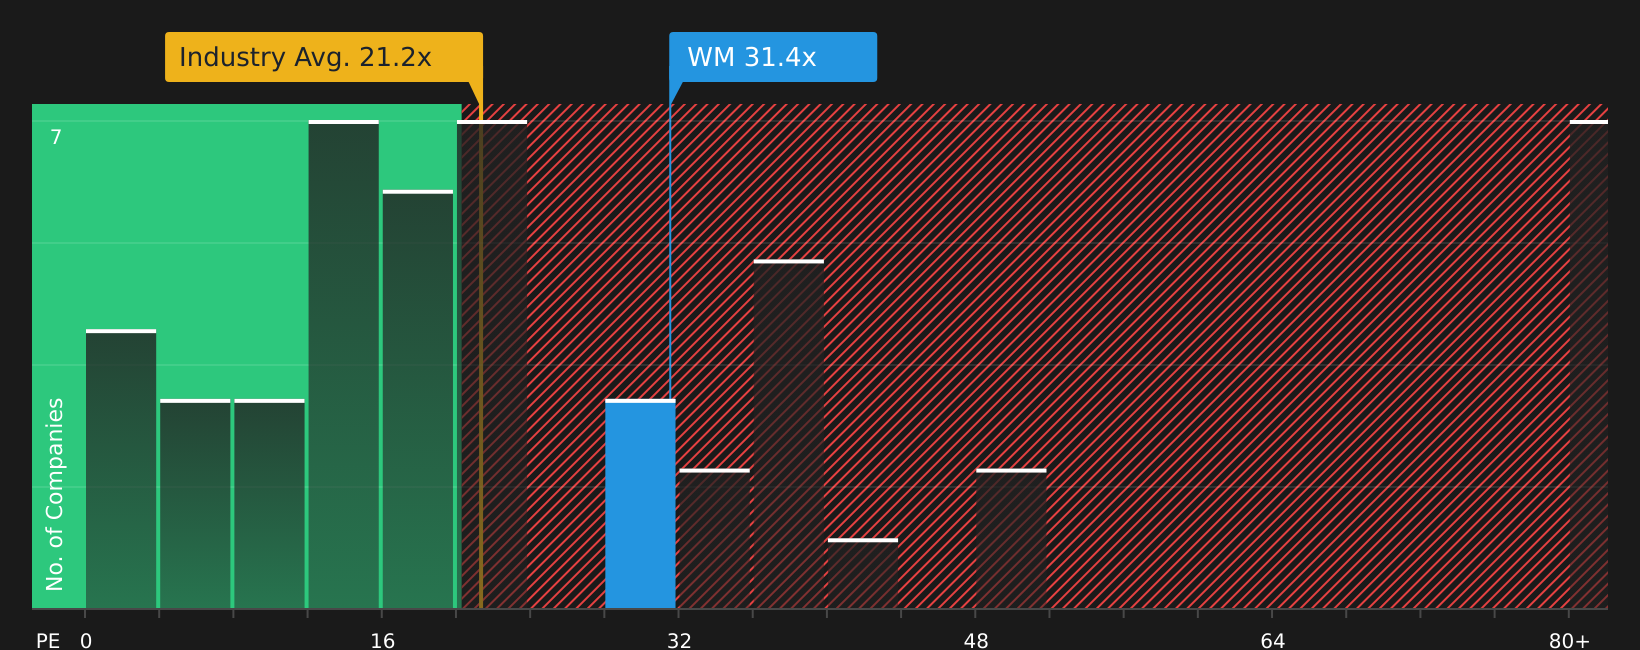
Waste Management currently trades on a P/E of 32.24x. That sits above the Commercial Services industry average of 20.77x, and slightly below the peer group average of 33.22x. Simply Wall St’s Fair Ratio for Waste Management is 25.89x, which reflects a proprietary view of what its P/E might be given factors like earnings growth, industry, profit margin, market cap and risk profile.
The Fair Ratio is more tailored than a simple peer or industry comparison because it adjusts for company specific traits such as growth, risks and profitability, as well as the sector it operates in and its size. Comparing the current P/E of 32.24x with the Fair Ratio of 25.89x suggests the stock is trading at a premium to that model based view.
Result: OVERVALUED
Wall Street's queuing for one rocket. While SpaceX counts down to its IPO, other companies tied to the new space race are already in orbit. → 20 Compelling Space Companies watchlist · Global Space Race Investing Ideas screener · Scan the sector by valuation on Rocket Lab's valuation page.
Upgrade Your Decision Making: Choose your Waste Management Narrative
Earlier it was mentioned that there is an even better way to understand valuation, so Narratives are introduced as a simple way for you to write a clear story about Waste Management, link that story to specific assumptions for future revenue, earnings and margins, turn those assumptions into a fair value, and then compare that fair value with the current price. All of this can be done within Simply Wall St's Community page, where Narratives are updated automatically when new news or earnings arrive. For example, one investor might build a Narrative that leans toward the higher analyst fair value view around US$277 based on confidence in technology, sustainability projects and WM Healthcare Solutions. Another might anchor closer to the lower fair value view around US$198 because of concerns about leverage, regulatory changes or revenue volatility. Both can quickly see whether their story suggests the stock is expensive or attractive compared with where it trades today.
Do you think there's more to the story for Waste Management? Head over to our Community to see what others are saying!

This article by Simply Wall St is general in nature. We provide commentary based on historical data and analyst forecasts only using an unbiased methodology and our articles are not intended to be financial advice. It does not constitute a recommendation to buy or sell any stock, and does not take account of your objectives, or your financial situation. We aim to bring you long-term focused analysis driven by fundamental data. Note that our analysis may not factor in the latest price-sensitive company announcements or qualitative material. Simply Wall St has no position in any stocks mentioned.
Have feedback on this article? Concerned about the content? Get in touch with us directly. Alternatively, email editorial-team@simplywallst.com