


- Wondering whether Tronox Holdings at US$7.74 still offers value or if most of the opportunity is already priced in? This article walks through the key numbers that matter for you.
- The stock is up 81.3% year to date and 39.7% over the past year, even though it is down 11.5% over the past month and slightly lower over the past week. These moves can change how you think about both upside and risk.
- Recent coverage around Tronox has focused on its position within the broader materials sector and how investors are reassessing companies tied to industrial demand and commodity exposure. This context helps explain why the stock has seen strong year to date gains alongside short term pullbacks as expectations are reset.
- Tronox currently scores a 5 out of 6 valuation check score on Simply Wall St, which you can review in detail through the valuation score. The next sections will compare different valuation methods before finishing with a more complete way to think about what this figure means for you.
Approach 1: Tronox Holdings Discounted Cash Flow (DCF) Analysis
A Discounted Cash Flow, or DCF, model estimates what a stock might be worth by projecting the company’s future cash flows and discounting them back to today’s value using a required return. It is essentially asking what all those future dollars are worth in today’s terms.
For Tronox Holdings, the model uses a 2 Stage Free Cash Flow to Equity approach. The latest twelve month free cash flow is a loss of $287.3 million. Analysts and extrapolated estimates then project free cash flow turning positive and reaching $240.5 million in 2035, with interim years such as $41.3 million in 2026 and $100 million in 2028. Simply Wall St only uses direct analyst inputs for the earlier years, and then extrapolates further out using its own assumptions.
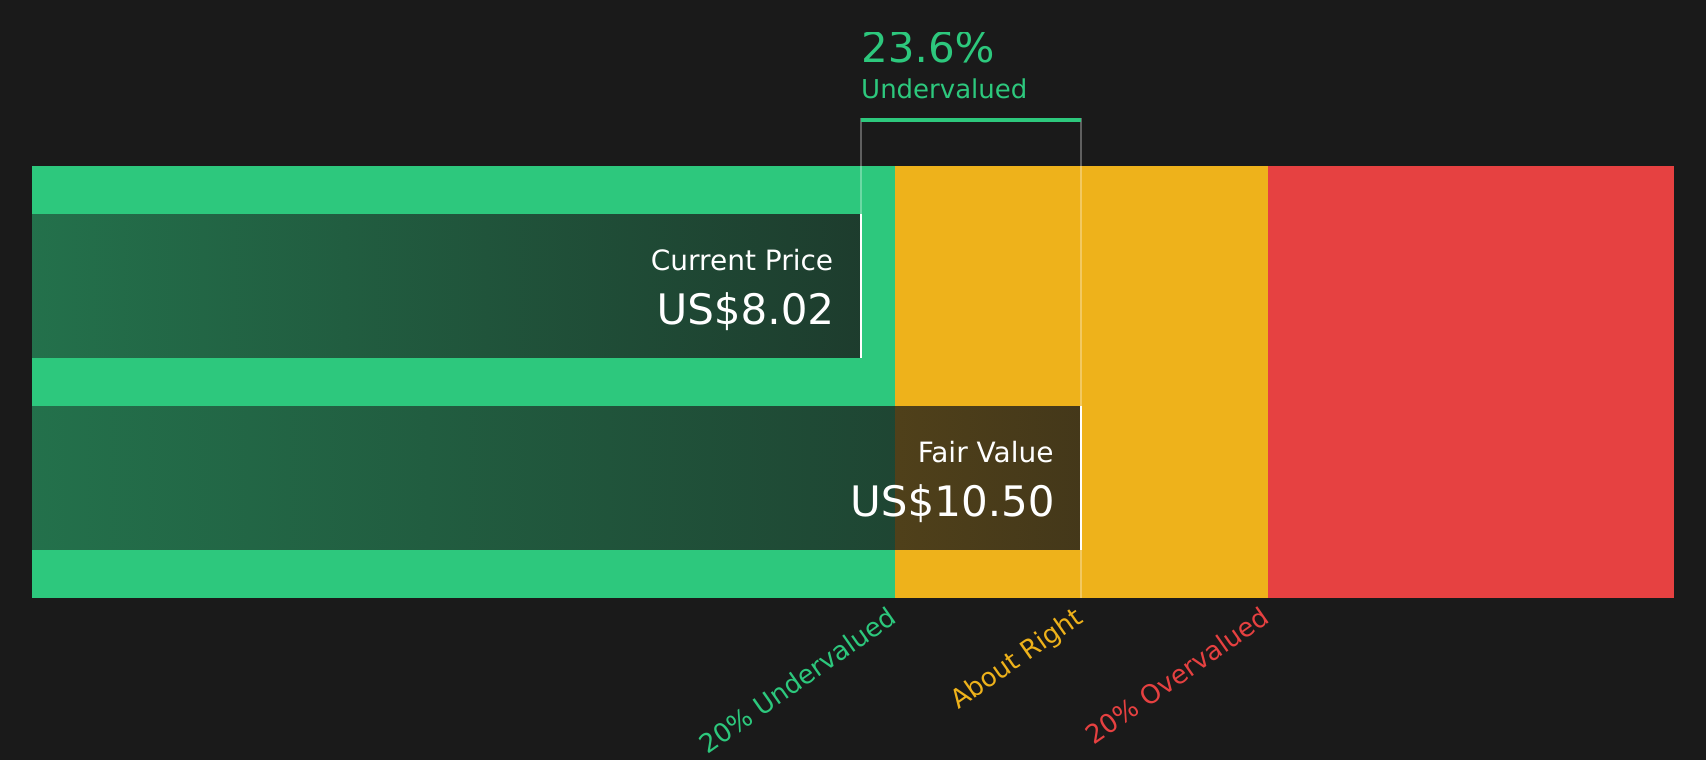
Discounting these projected cash flows back to today results in an estimated intrinsic value of about $10.03 per share, compared with the current share price of $7.74. On this measure, the stock screens as approximately 22.8% undervalued.
Result: UNDERVALUED
Our Discounted Cash Flow (DCF) analysis suggests Tronox Holdings is undervalued by 22.8%. Track this in your watchlist or portfolio, or discover 46 more high quality undervalued stocks.
Approach 2: Tronox Holdings Price vs Sales
For companies where earnings are less consistent, the P/S ratio can be a useful way to think about value because it compares what you pay for each dollar of revenue rather than profit. Investors usually accept a higher or lower P/S depending on expectations for future growth and the level of risk, so there is no single “right” number.
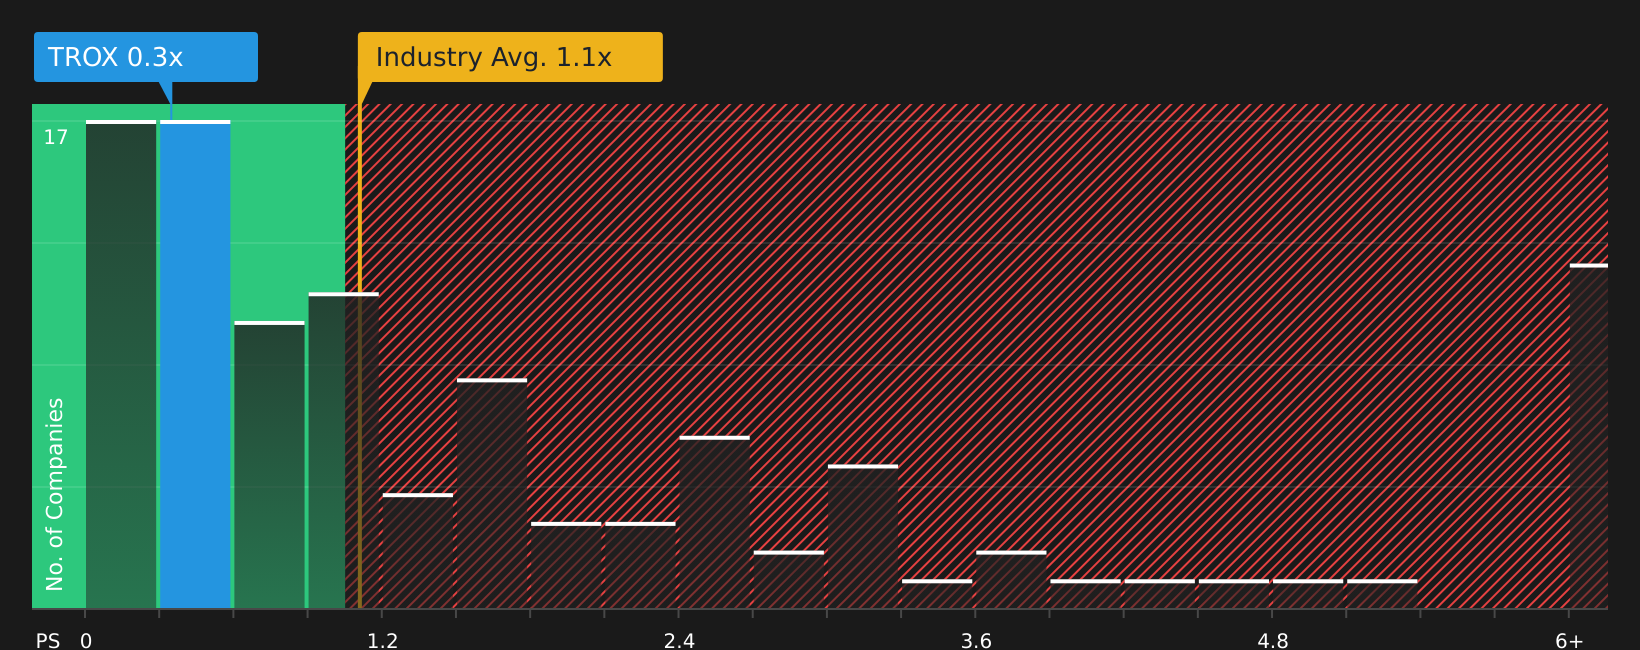
Tronox Holdings currently trades on a P/S of 0.42x. This sits below the Chemicals industry average P/S of 1.15x and also below the peer group average of 0.47x. This might initially suggest a lower valuation compared with many competitors.
Simply Wall St’s Fair Ratio for Tronox is 0.94x. This is a proprietary estimate of what a reasonable P/S could be, given factors such as the company’s earnings growth profile, industry, profit margins, market cap and specific risks. Because it adjusts for these company level traits, the Fair Ratio can offer a more tailored benchmark than a simple comparison with industry or peer averages.
Comparing Tronox’s actual P/S of 0.42x with the Fair Ratio of 0.94x indicates that the stock screens as undervalued on this measure.
Result: UNDERVALUED
P/S ratios tell one story, but what if the real opportunity lies elsewhere? Start investing in legacies, not executives. Discover our 20 top founder-led companies.
Upgrade Your Decision Making: Choose your Tronox Holdings Narrative
Earlier it was mentioned that there is an even better way to understand valuation. Narratives take the numbers you have already seen and let you attach a clear story to them, linking your view of Tronox Holdings, your assumptions for future revenue, earnings and margins, and the fair value you think is reasonable. You can then compare that fair value with the current share price to help you decide whether the stock looks attractively or richly priced. All of this happens inside the Simply Wall St Community page, where Narratives are updated automatically when new news or earnings arrive. For Tronox, you might see one investor build a more cautious story that aligns with a Fair Value of about US$4.00, while another uses the same tools to set a more optimistic Fair Value closer to US$10.00. Both can see in real time how fresh information shifts their story, forecasts and implied opportunity or risk.
For Tronox Holdings however we will make it really easy for you with previews of two leading Tronox Holdings Narratives:
Fair value in this bullish narrative: US$7.88 per share
Implied pricing gap vs last close: around 1.8% above that fair value
Revenue growth used in this story: 5.12%
- Expects TiO₂ demand in faster growing regions such as India, together with trade measures that support Tronox, to support higher future revenues.
- Builds in sizeable cost savings and efficiency gains from vertical integration and mining investments, with the aim of lifting margins over time.
- Sees a mix of regulatory, market, and debt related pressures as important risks that could limit how much of that earnings recovery ultimately comes through.
Fair value in this bearish narrative: US$4.00 per share
Implied pricing gap vs last close: about 93.5% above that fair value
Revenue growth used in this story: 3.58%
- Focuses on higher regulatory and environmental costs, plus pressure from alternative pigments, as potential drags on long term TiO₂ demand and profitability.
- Highlights high leverage and debt as key financial risks, especially if TiO₂ pricing and volumes remain under pressure.
- Allows for upside if cost savings, mining integration, rare earth projects and industry capacity cuts all play out more positively than the core bearish assumptions.
If you want to see how other investors are connecting these numbers into a full story, and how new data might tilt Tronox Holdings toward either the bullish or bearish camp, See what the community is saying about Tronox Holdings.
Do you think there's more to the story for Tronox Holdings? Head over to our Community to see what others are saying!

This article by Simply Wall St is general in nature. We provide commentary based on historical data and analyst forecasts only using an unbiased methodology and our articles are not intended to be financial advice. It does not constitute a recommendation to buy or sell any stock, and does not take account of your objectives, or your financial situation. We aim to bring you long-term focused analysis driven by fundamental data. Note that our analysis may not factor in the latest price-sensitive company announcements or qualitative material. Simply Wall St has no position in any stocks mentioned.
Have feedback on this article? Concerned about the content? Get in touch with us directly. Alternatively, email editorial-team@simplywallst.com