


- Wondering whether KKR at around US$95.30 is offering good value or just headline noise? This article walks through the numbers so you can judge the price tag with more confidence.
- The stock is down slightly over the last week, down over the past month, and has fallen 26.1% year to date and 23.4% over the past year, even though the 3 year and 5 year returns stand at 66.0% and 74.0% respectively.
- Recent coverage has focused on how the stock's pullback and year to date decline have shifted the conversation around risk and return for KKR. Commentators have also highlighted how private markets, alternative assets and deal activity trends are shaping expectations for the business and its valuation.
- Right now KKR scores 3 out of 6 on Simply Wall St's valuation checks. You can see the detailed breakdown behind that score here. Next up is a closer look at the different ways to value the stock and, at the end of the article, a broader framework that can help you put all these methods in context.
Find out why KKR's -23.4% return over the last year is lagging behind its peers.
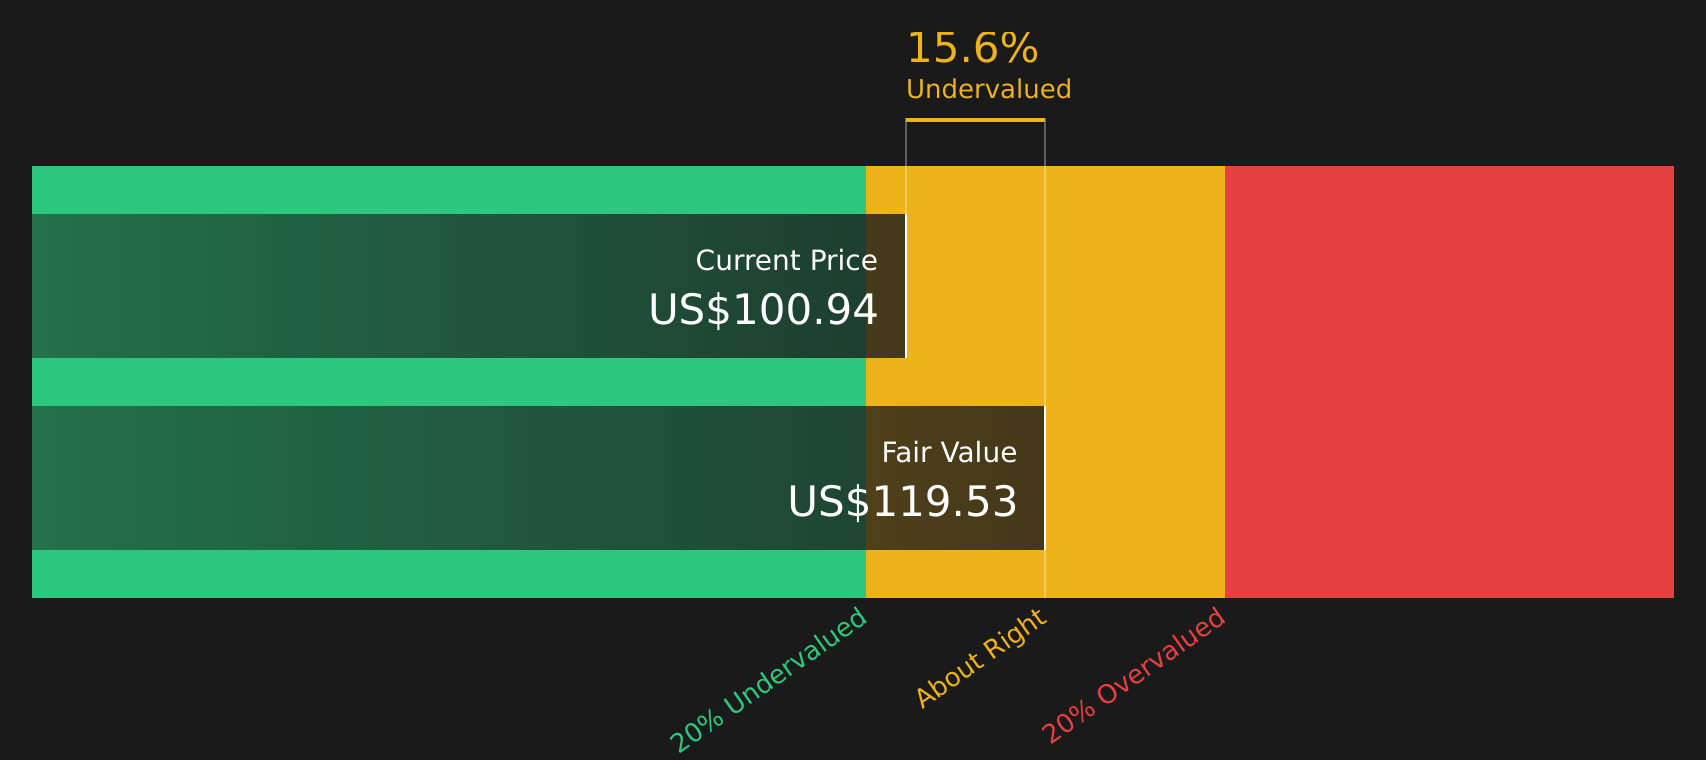
Approach 1: KKR Excess Returns Analysis
The Excess Returns model looks at how much profit KKR can generate on its equity above the return that investors require, then capitalizes those extra profits into an estimated value per share.
For KKR, the model uses a Book Value of $31.43 per share and a Stable EPS of $8.65 per share, based on weighted future Return on Equity estimates from 5 analysts. The implied Average Return on Equity is 12.49%, while the Cost of Equity is $6.29 per share. That gap creates an Excess Return of $2.36 per share, which is the core input to this valuation approach.
The analysis also uses a Stable Book Value of $69.27 per share, sourced from weighted future Book Value estimates from 4 analysts, to extend those excess returns into the future. Together, these inputs produce an Excess Returns intrinsic value of about $111.87 per share.
Compared with the recent share price around $95.30, this model points to a 14.8% discount, which indicates the stock screens as undervalued on this excess profitability lens.
Result: UNDERVALUED
Our Excess Returns analysis suggests KKR is undervalued by 14.8%. Track this in your watchlist or portfolio, or discover 46 more high quality undervalued stocks.
Approach 2: KKR Price vs Earnings
For a profitable company, the P/E ratio is a straightforward way to connect the price you pay with the earnings the business currently generates. It gives you a quick sense of how many dollars investors are willing to pay for each dollar of earnings.
In general, higher growth expectations and lower perceived risk can support a higher P/E ratio, while slower growth and higher risk usually line up with a lower, more cautious multiple. That is why it helps to compare a stock's P/E with relevant benchmarks rather than in isolation.
KKR currently trades on a P/E of 30.53x. That sits below the Capital Markets industry average P/E of 39.52x but above the peer group average of 23.28x. Simply Wall St's Fair Ratio for KKR is 24.02x, which is a proprietary estimate of what the P/E might be given factors such as earnings growth, profit margins, industry, market cap and risk profile.
The Fair Ratio approach can be more tailored than a simple peer or industry comparison, because it adjusts for company specific characteristics rather than assuming all stocks in the group deserve similar multiples. Against this Fair Ratio of 24.02x, KKR's actual P/E of 30.53x screens as higher, suggesting the stock looks more expensive on this earnings based yardstick.
Result: OVERVALUED

P/E ratios tell one story, but what if the real opportunity lies elsewhere? Start investing in legacies, not executives. Discover our 20 top founder-led companies.
Upgrade Your Decision Making: Choose your KKR Narrative
Earlier it was mentioned that there is an even better way to understand valuation. This is where Narratives come in as a simple way for you to connect KKR's story with the numbers behind it, by pairing your view on the business with assumptions about future revenue, earnings, margins and a fair value estimate.
On Simply Wall St's Community page, Narratives let you turn that story into a clear financial forecast and a fair value, then compare it with the current share price so you can judge whether KKR looks cheap or expensive against your own expectations, rather than only relying on a single P/E screen.
Because Narratives update when fresh information such as KKR's Q1 2026 results, new deals or analyst revisions are added, you are not locked into a static view and can quickly see how changes in fee related earnings, credit risk or insurance earnings flow through to fair value.
For example, one KKR Narrative on the platform uses a higher fair value of about US$150.18, built around more optimistic revenue, margin and P/E assumptions. Another uses a lower fair value of about US$84.45 with more conservative inputs, so you can see in one place how different investors interpret the same stock and decide which version of the story fits your own view best.
For KKR however we will make it really easy for you with previews of two leading KKR Narratives:
These sit on opposite sides of the debate but they share one goal, to give you a clear link between story, assumptions and an implied value per share so you can decide which version feels closer to your own view.
Fair value: US$140.24 per share
Implied discount vs last close at US$95.30: about 32.0%
Revenue growth assumption: 17.85%
- Analysts in this narrative see KKR as a fee compounding platform built on private markets, data centers and an IPO pipeline, with fee related earnings and profit margins that are modeled to improve over time.
- The view leans on fundraising momentum, the build out of credit and asset based finance, and a large pool of unrealized carried interest as potential support for future fee and performance revenue.
- Even so, the narrative flags risks around competition, fee compression, regulation, geopolitical events and the possibility that long term returns from alternatives and private credit come in lower than expected.
Fair value: US$84.45 per share
Implied premium vs last close at US$95.30: about 12.8%
Revenue growth assumption: 7.0%
- This narrative is built around a Buffett style owner earnings view that focuses on recurring fee income, insurance earnings and strategic holdings, and then applies conservative growth and discount rate assumptions.
- Credit exposure, the reliance on private markets cycles and the need to keep deploying capital at attractive returns are treated as key constraints on what investors might reasonably pay for the stock.
- On this logic, KKR is framed as a solid capital compounding business but one where price matters, with the fair value range leaving less room for error if credit conditions weaken or fundraising slows.
If you want to see how other investors are joining the dots between these scenarios and their own assumptions, it is worth taking a few minutes to review the full bull and bear Narratives side by side and see which inputs, risks and fair values line up best with your own expectations for KKR.
Curious how numbers become stories that shape markets? Explore Community Narratives
Do you think there's more to the story for KKR? Head over to our Community to see what others are saying!

This article by Simply Wall St is general in nature. We provide commentary based on historical data and analyst forecasts only using an unbiased methodology and our articles are not intended to be financial advice. It does not constitute a recommendation to buy or sell any stock, and does not take account of your objectives, or your financial situation. We aim to bring you long-term focused analysis driven by fundamental data. Note that our analysis may not factor in the latest price-sensitive company announcements or qualitative material. Simply Wall St has no position in any stocks mentioned.
Have feedback on this article? Concerned about the content? Get in touch with us directly. Alternatively, email editorial-team@simplywallst.com