


How Ladder Capital Stock Has Been Performing Recently
Ladder Capital (LADR) has drawn investor attention after a mixed run in its share price, with the stock down over the year to date but showing gains over the past 3 months and year.
This performance sits against reported revenue of $216.26 million and net income of $55.012 million, figures that help frame how the market is currently pricing this US$1.31b real estate investment trust.
See our latest analysis for Ladder Capital.
The latest share price of $10.11 comes after a year-to-date share price decline of 8.92%, even as the 1 year total shareholder return of 3.96% and 3 year total shareholder return of 21.25% point to steadier longer term gains.
If Ladder Capital has you looking beyond a single stock, this is a good moment to broaden your watchlist with 20 top founder-led companies
So with Ladder Capital shares down 8.92% year to date, but showing a 3.96% 1-year total return and trading at US$10.11, is this a potential value opportunity, or is the market already pricing in future growth?
Price-to-Earnings of 23.5x: Is It Justified for Ladder Capital Stock?
On earnings, Ladder Capital currently trades on a P/E of 23.5x, which sits against a last close of $10.11 and raises questions about how the market is framing its profit outlook.
The P/E ratio compares the company’s share price to its earnings per share, so a higher figure often means investors are paying more today for each dollar of current earnings. For a mortgage REIT like Ladder Capital, that can hint at expectations for stronger future earnings, a perceived quality premium on its income streams, or both.
Here, the comparison is blunt. Ladder Capital trades at 23.5x earnings while the broader US Mortgage REITs industry sits around 11.6x, and its own estimated fair P/E based on the SWS fair ratio framework is 15.4x. That places the stock at a much richer earnings multiple than both sector peers and the fair ratio level the market could potentially move toward if sentiment or expectations cool.
Explore the SWS fair ratio for Ladder Capital
Result: Price-to-Earnings of 23.5x (OVERVALUED)
However, investors in Ladder Capital still face risks if higher funding costs pressure loan profitability or if commercial real estate credit conditions weaken and affect asset performance.
Find out about the key risks to this Ladder Capital narrative.
Another View on Ladder Capital Using the SWS DCF Model
The P/E ratio paints Ladder Capital stock as expensive, but the SWS DCF model points in the same direction for a different reason. With the shares at $10.11 and the model’s future cash flow value at $7.66, the stock screens as overvalued on cash flows too, leaving you to ask which signal matters more for your own risk tolerance.
For a closer look at the assumptions behind this cash flow view, Look into how the SWS DCF model arrives at its fair value.
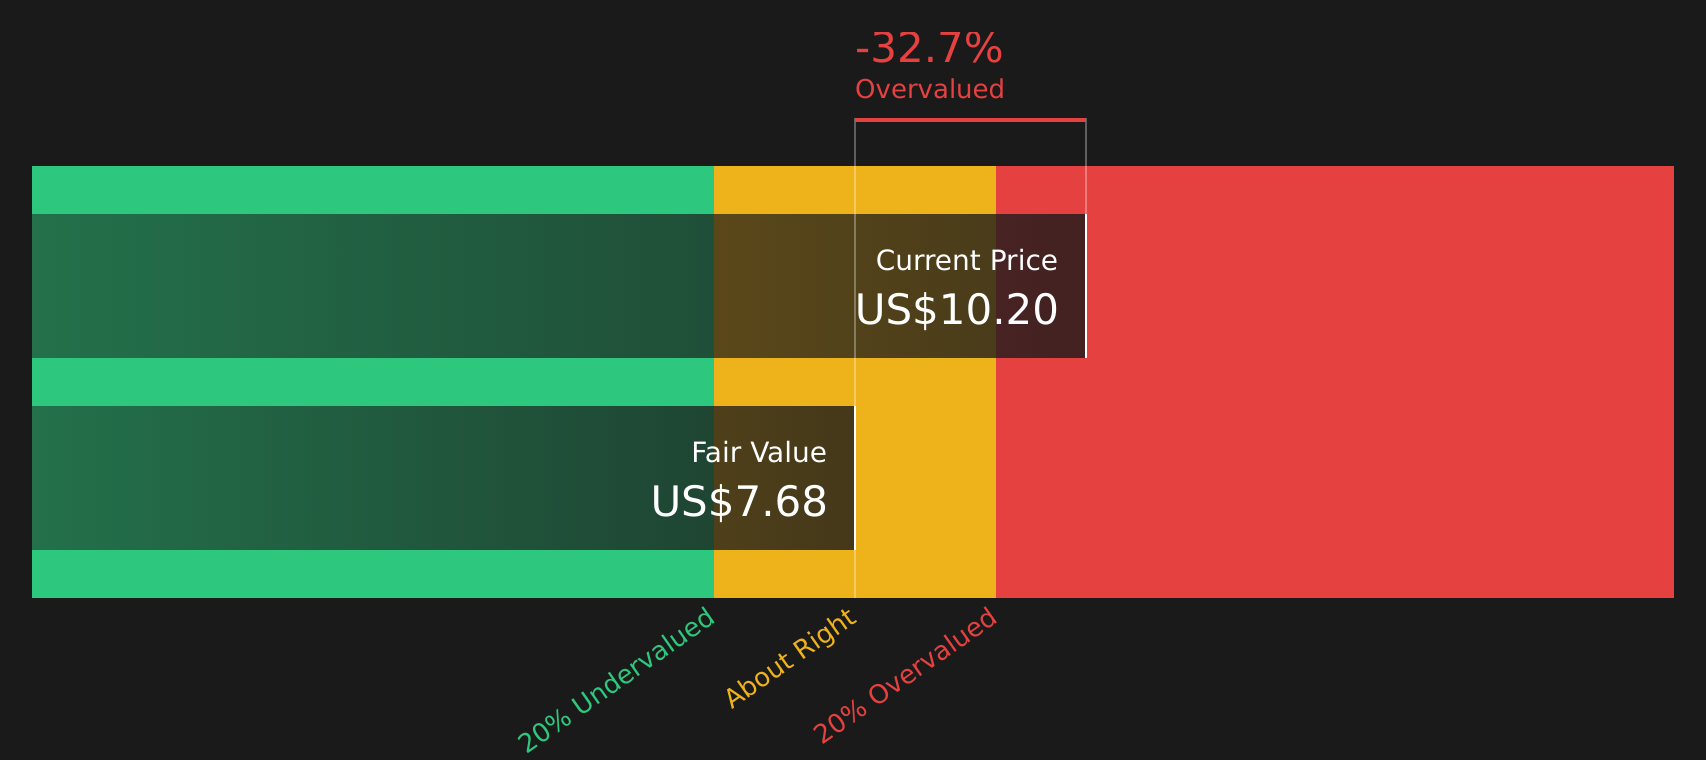
Simply Wall St performs a discounted cash flow (DCF) on every stock in the world every day (check out Ladder Capital for example). We show the entire calculation in full. You can track the result in your watchlist or portfolio and be alerted when this changes, or use our stock screener to discover 48 high quality undervalued stocks. If you save a screener we even alert you when new companies match - so you never miss a potential opportunity.
Next Steps
If this mixed picture on Ladder Capital has you unsure, now is a good time to review the underlying data and consider both perspectives. You can then round out your view by checking 2 key rewards and 4 important warning signs
Looking for more investment ideas beyond Ladder Capital?
If Ladder Capital has sharpened your thinking, do not stop here. Broaden your opportunity set with a few targeted stock ideas built from the Simply Wall St screener.
- Target long term compounding potential with 48 high quality undervalued stocks that combine solid fundamentals with prices that may not fully reflect their underlying business strength.
- Prioritise resilience and capital preservation by checking 65 resilient stocks with low risk scores designed to highlight companies with lower risk scores and sturdier profiles.
- Hunt for future standouts before they are widely followed using the screener containing 20 high quality undiscovered gems that filters for quality businesses still flying under most investors' radar.
This article by Simply Wall St is general in nature. We provide commentary based on historical data and analyst forecasts only using an unbiased methodology and our articles are not intended to be financial advice. It does not constitute a recommendation to buy or sell any stock, and does not take account of your objectives, or your financial situation. We aim to bring you long-term focused analysis driven by fundamental data. Note that our analysis may not factor in the latest price-sensitive company announcements or qualitative material. Simply Wall St has no position in any stocks mentioned.
Have feedback on this article? Concerned about the content? Get in touch with us directly. Alternatively, email editorial-team@simplywallst.com