


St. Joe (JOE) is back on investors’ radar after recent share price moves. This has prompted a closer look at how the real estate-focused company’s mix of residential, hospitality, and commercial operations supports its current valuation.
See our latest analysis for St. Joe.
At a recent share price of US$63.48, St. Joe’s short term share price performance has softened, with the 90 day share price return down 7.73%, even as the 1 year total shareholder return stands at 36.90% and the 5 year total shareholder return at 52.30%. This suggests that earlier momentum has cooled, while longer term holders still see a solid gain.
If St. Joe’s recent moves have you reassessing your watchlist, this can be a useful moment to broaden your search with 20 top founder-led companies
So with St. Joe trading at US$63.48 and an estimated intrinsic discount of about 48%, should you see this as a genuine value opportunity, or are markets already pricing in all of the company’s future growth potential?
Price-to-Earnings of 32.5x: Is it justified?
On a P/E multiple, St. Joe appears expensive, with the stock trading at 32.5x earnings compared with an average of 12.9x for peers and 25x for the broader US Real Estate industry. That is a sizeable premium on the current share price of $63.48, even after the recent cooling in short term performance.
The P/E ratio compares what investors are paying today for each dollar of current earnings. For a company like St. Joe, which operates across residential, hospitality, and commercial real estate, a higher P/E usually reflects expectations around the quality and durability of earnings, the mix of assets, and the potential for future cash generation.
Here, the numbers show the market assigning St. Joe a meaningfully higher earnings multiple than both its direct peers and the wider industry. With the stock at 32.5x earnings against 12.9x for peers and 25x for the US Real Estate industry, investors are paying a clear premium that suggests strong confidence is already embedded in the price.
See what the numbers say about this price — find out in our valuation breakdown.
Result: Price-to-Earnings of 32.5x (OVERVALUED)
However, St. Joe’s premium P/E could be pressured if earnings soften or if real estate demand weakens across its residential, hospitality, and commercial segments.
Find out about the key risks to this St. Joe narrative.
Another view on St. Joe’s valuation
While the P/E of 32.5x makes St. Joe look expensive versus peers, the SWS DCF model points in the opposite direction. With an estimated future cash flow value of about $121.60 per share, the current $63.48 price screens as materially undervalued. So which signal should matter more for you?
Look into how the SWS DCF model arrives at its fair value.
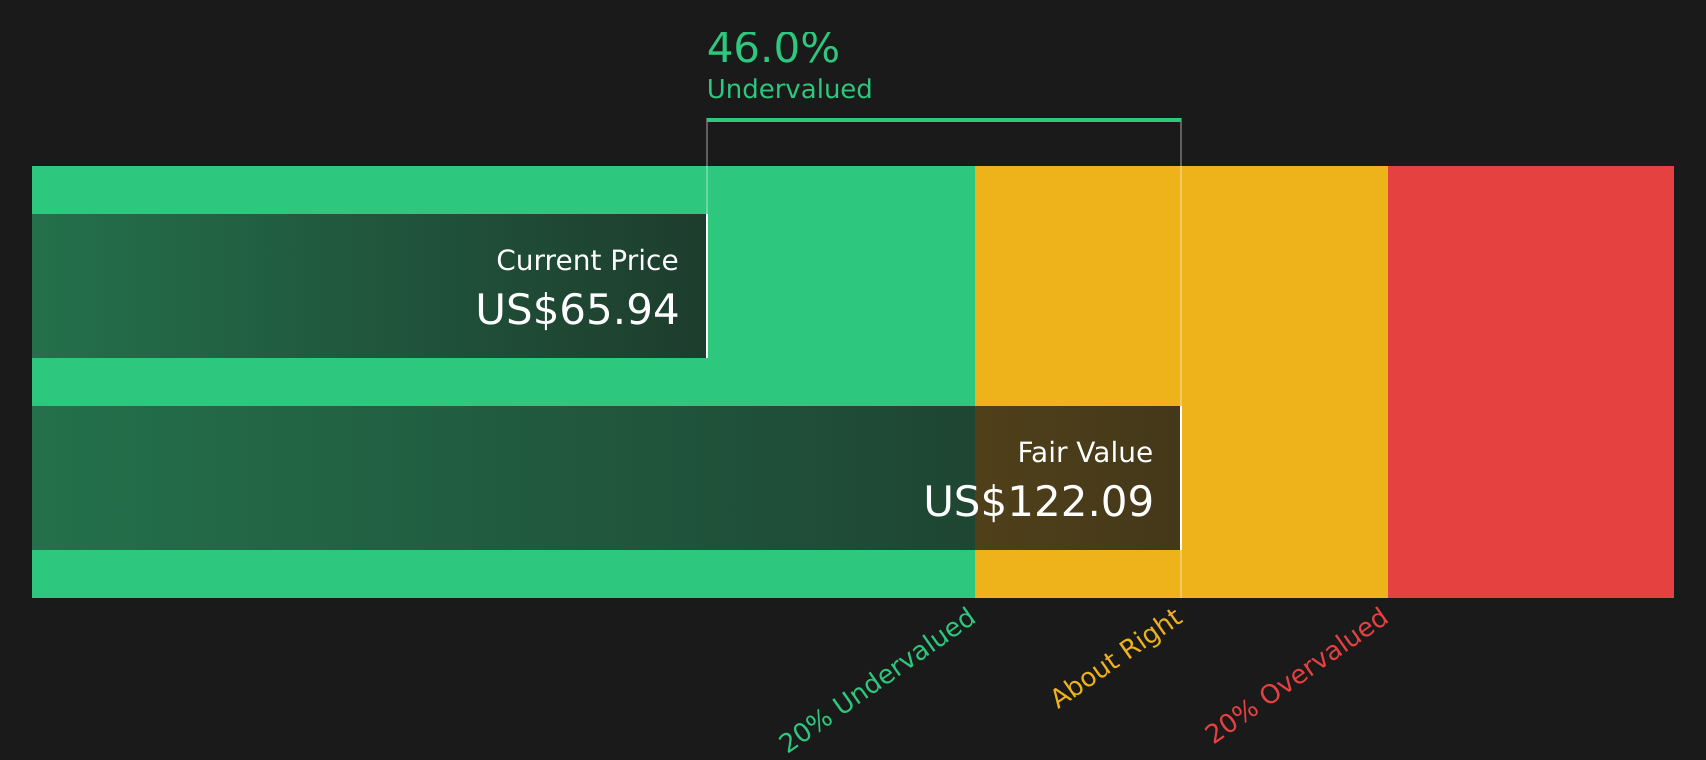
Simply Wall St performs a discounted cash flow (DCF) on every stock in the world every day (check out St. Joe for example). We show the entire calculation in full. You can track the result in your watchlist or portfolio and be alerted when this changes, or use our stock screener to discover 48 high quality undervalued stocks. If you save a screener we even alert you when new companies match - so you never miss a potential opportunity.
Next Steps
With sentiment on St. Joe split between a rich P/E multiple and a discounted cash flow signal, it makes sense to review the data firsthand and act promptly based on your own judgement, then round out your view by checking the 2 key rewards and 1 important warning sign
Looking for more investment ideas beyond St. Joe?
If St. Joe has sharpened your focus, do not stop here. Use the Simply Wall Street screener to quickly spot fresh opportunities that match your investing style.
- Target potential bargains by reviewing companies that currently screen as 48 high quality undervalued stocks and see which ones deserve a closer look.
- Prioritise resilience by checking out 65 resilient stocks with low risk scores so you can focus on businesses with steadier risk profiles.
- Get ahead of the crowd by scanning the screener containing 20 high quality undiscovered gems before other investors start paying attention.
This article by Simply Wall St is general in nature. We provide commentary based on historical data and analyst forecasts only using an unbiased methodology and our articles are not intended to be financial advice. It does not constitute a recommendation to buy or sell any stock, and does not take account of your objectives, or your financial situation. We aim to bring you long-term focused analysis driven by fundamental data. Note that our analysis may not factor in the latest price-sensitive company announcements or qualitative material. Simply Wall St has no position in any stocks mentioned.
Have feedback on this article? Concerned about the content? Get in touch with us directly. Alternatively, email editorial-team@simplywallst.com