


ICL Group (NYSE:ICL) is back in focus after agreeing to supply 375,000 metric tons of potash, with an option for another 50,000 tons, to Indian Potash Limited at current Indian market prices.
See our latest analysis for ICL Group.
Against this contract news and the recent US$800 million bond issue, ICL Group’s share price has been under pressure, with a 30 day share price return down 21.52% and a 1 year total shareholder return down 22.81%, which indicates fading momentum despite a long term potash supply framework.
If you are looking beyond ICL Group to other materials related opportunities, this could be a useful moment to scan 29 best rare earth metal stocks
With ICL Group trading at US$5.07 after a period of falling returns and sitting at a roughly 23% intrinsic discount estimate and 27% below analyst targets, the key question is whether this represents a buying opportunity or whether the market is already pricing in future growth.
Price-to-Earnings of 25.1x: Is it justified for ICL Group?
ICL Group currently trades on a P/E of 25.1x, which sits below the peer average of 46.3x and slightly below the broader US Chemicals industry average of 25.8x, while the share price is at $5.07.
The P/E ratio compares what investors are paying for each dollar of current earnings. For a diversified minerals and chemicals producer like ICL Group, this metric is often used as a quick gauge of how the market is weighing its earnings profile, capital intensity and exposure to cyclical end markets such as agriculture and industrial chemicals.
With ICL Group priced at a discount both to its direct peers and to its own discounted cash flow estimate of $6.56 per share, the current P/E suggests the market is assigning a relatively cautious value to earnings, despite the stock also trading 27.2% below analyst price targets and 22.7% below an internal fair value estimate.
Compared with the US Chemicals industry P/E of 25.8x, ICL Group’s 25.1x multiple is only marginally lower, which points to a valuation that is roughly in line with the sector rather than deeply out of step, even as the company’s 1 year total shareholder return has lagged both the industry and the broader US market.
See what the numbers say about this price — find out in our valuation breakdown.
Result: Price-to-Earnings of 25.1x (ABOUT RIGHT)
However, ICL Group still faces risks such as the recent share price weakness and its exposure to cyclical demand in agriculture and industrial chemicals.
Find out about the key risks to this ICL Group narrative.
Another view on ICL Group’s value
While ICL Group’s 25.1x P/E looks roughly in line with the US Chemicals industry, the SWS DCF model indicates a fair value of $6.56 per share, compared with the current $5.07 price. That suggests the stock is trading at a discount, but how comfortable are you with the assumptions behind that cash flow outlook?
Look into how the SWS DCF model arrives at its fair value.
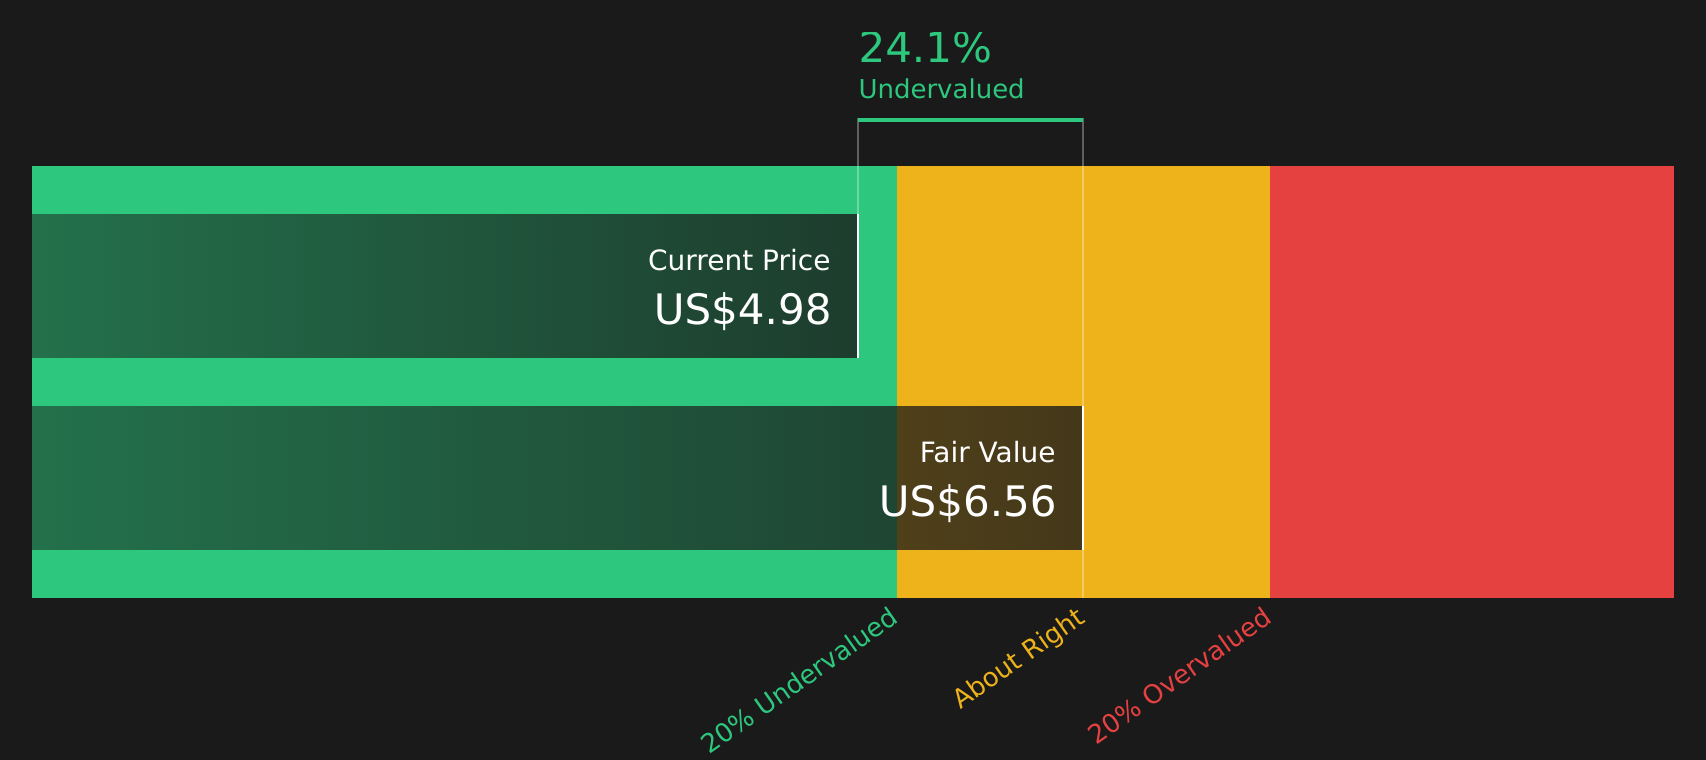
Simply Wall St performs a discounted cash flow (DCF) on every stock in the world every day (check out ICL Group for example). We show the entire calculation in full. You can track the result in your watchlist or portfolio and be alerted when this changes, or use our stock screener to discover 44 high quality undervalued stocks. If you save a screener we even alert you when new companies match - so you never miss a potential opportunity.
Next Steps
Given that ICL Group shows both risks that investors are watching and potential rewards that others are excited about, it makes sense to review the details and decide where you stand using the 2 key rewards and 5 important warning signs
Looking for more investment ideas beyond ICL Group?
If you want a broader watchlist alongside ICL Group, use these focused stock lists to spot ideas you might wish you had checked sooner.
- Target potential mispriced opportunities early by scanning companies screened as 44 high quality undervalued stocks before they appear on everyone else's radar.
- Prioritize income by reviewing stocks in the 7 dividend fortresses that combine higher yields with a focus on durability.
- Dial down portfolio stress by checking out resilient companies flagged in the 69 resilient stocks with low risk scores so you are not only relying on higher volatility ideas.
This article by Simply Wall St is general in nature. We provide commentary based on historical data and analyst forecasts only using an unbiased methodology and our articles are not intended to be financial advice. It does not constitute a recommendation to buy or sell any stock, and does not take account of your objectives, or your financial situation. We aim to bring you long-term focused analysis driven by fundamental data. Note that our analysis may not factor in the latest price-sensitive company announcements or qualitative material. Simply Wall St has no position in any stocks mentioned.
Have feedback on this article? Concerned about the content? Get in touch with us directly. Alternatively, email editorial-team@simplywallst.com