


CorVel (CRVL) has introduced Marketwise Repricing, a market-based medical bill repricing tool that plugs into its existing bill review programs and targets complex, high-variance or out-of-network billing scenarios for clients.
See our latest analysis for CorVel.
CorVel’s launch of Marketwise Repricing comes as the stock trades at US$61.65, with the 90 day share price return up 15.02% but the 1 year total shareholder return down 40.91%. This suggests short term momentum has picked up while longer term performance has remained weak.
If you are weighing CorVel’s new product against other opportunities in healthcare technology, it could be a good moment to scan the market using the 41 healthcare AI stocks
With CorVel trading at US$61.65 and showing weaker multi year returns despite its new Marketwise Repricing product and US$958.527 million in revenue, are you looking at an undervalued stock here, or is the market already pricing in future growth?
Preferred P/E of 28.3x: Is it justified?
CorVel is trading at $61.65 and carries a P/E of 28.3x, which sits well below its peer average of 96.3x but above the wider US Healthcare industry at 25.1x. That mix of cheaper pricing versus close peers but a premium versus the broader industry is where the valuation debate really starts.
The P/E ratio compares CorVel’s share price with its earnings per share, so a 28.3x multiple effectively shows how much investors are paying for each dollar of current earnings. For a company focused on workers’ compensation, liability and payment integrity solutions, where recurring service revenues and software driven efficiencies can matter, the P/E is a common shorthand for how the market is weighing its earnings profile against other healthcare related stocks.
Relative to a peer average P/E of 96.3x, CorVel’s 28.3x suggests the stock is being priced at a lower earnings multiple than many closer comparables, even after factoring in its recent earnings growth of 16% and return on equity of 28%. At the same time, trading above the US Healthcare industry average P/E of 25.1x indicates investors are still assigning a premium versus the broader group, potentially reflecting its profitability, net income of $110.344 million on $958.527 million of revenue, and the focus on cost management solutions.
Compared with the SWS DCF model, which puts future cash flow value at $97.39 per share versus the current $61.65 price, the P/E picture is only part of the story. The DCF output suggests the market price sits well below that cash flow based estimate, which frames CorVel as trading at a discount relative to those modelled cash flows while its earnings multiple remains lower than peers but higher than the wider industry.
See what the numbers say about this price — find out in our valuation breakdown.
Result: Price-to-Earnings of 28.3x (UNDERVALUED)
However, CorVel’s weak 1 year and 3 year total returns, together with its single segment, US-only revenue base, could challenge the idea that the stock is mispriced.
Find out about the key risks to this CorVel narrative.
Another View: CorVel through a DCF lens
The earlier P/E discussion painted CorVel as attractively priced against closer peers but a bit richer than the broader US Healthcare group. Our DCF model, however, points to a different angle, with an estimated future cash flow value of $97.39 per share versus the current $61.65 price, which presents CorVel as undervalued on this measure.
That gap suggests the P/E market comparison and the SWS DCF model are telling slightly different stories about what investors are paying for CorVel’s cash flows today. For you, the question is whether the market is being too cautious on this stock or the DCF inputs are simply more optimistic than you are.
Look into how the SWS DCF model arrives at its fair value.
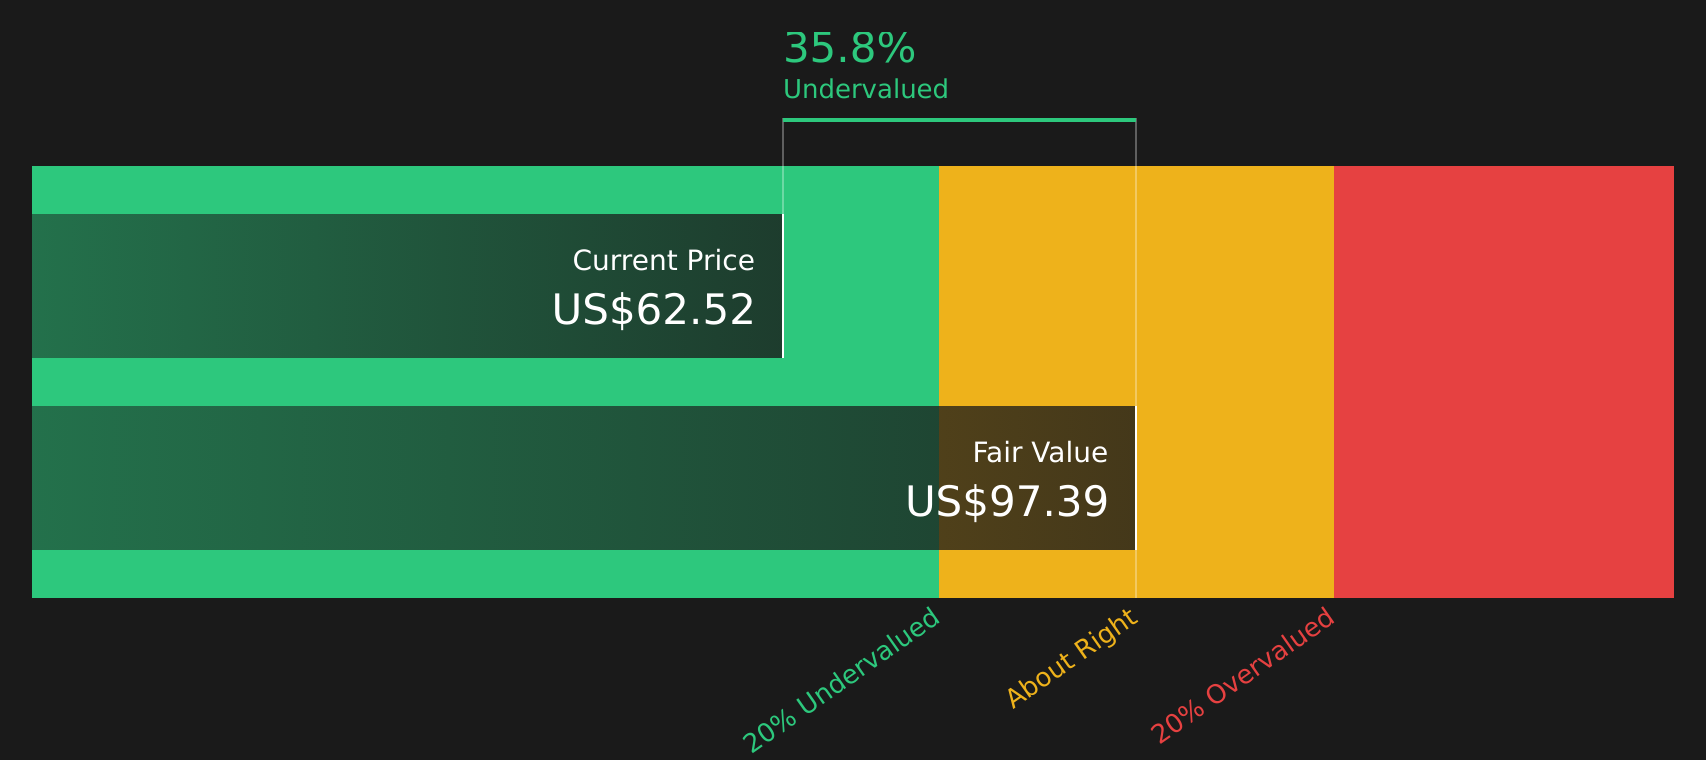
Simply Wall St performs a discounted cash flow (DCF) on every stock in the world every day (check out CorVel for example). We show the entire calculation in full. You can track the result in your watchlist or portfolio and be alerted when this changes, or use our stock screener to discover 42 high quality undervalued stocks. If you save a screener we even alert you when new companies match - so you never miss a potential opportunity.
Next Steps
If the mixed signals on CorVel have you on the fence, this is a good moment to review the data yourself and decide how the risk reward trade off stacks up. To weigh both sides in one place, start with the 2 key rewards and 1 important warning sign
Looking for more investment ideas beyond CorVel?
If CorVel has sharpened your focus on where value and risk can meet, now is the time to widen your search and pressure test your next move.
- Spot potential value opportunities early by scanning the market for companies that look attractively priced on quality metrics using the 42 high quality undervalued stocks.
- Prioritise resilience and sleep a little easier at night by filtering for companies with stronger risk profiles through the 72 resilient stocks with low risk scores.
- Hunt for potential future standouts before the crowd catches on by checking the screener containing 19 high quality undiscovered gems.
This article by Simply Wall St is general in nature. We provide commentary based on historical data and analyst forecasts only using an unbiased methodology and our articles are not intended to be financial advice. It does not constitute a recommendation to buy or sell any stock, and does not take account of your objectives, or your financial situation. We aim to bring you long-term focused analysis driven by fundamental data. Note that our analysis may not factor in the latest price-sensitive company announcements or qualitative material. Simply Wall St has no position in any stocks mentioned.
Have feedback on this article? Concerned about the content? Get in touch with us directly. Alternatively, email editorial-team@simplywallst.com