


Viasat (VSAT) is back in focus after securing a multi-year prime contract with the US Space Force to develop, launch, and operate a new fleet of advanced GEO communications satellites.
See our latest analysis for Viasat.
The latest contract win comes after a sharp swing in sentiment around Viasat, with a 7 day share price return of 38.43% and a 90 day share price return of 54.70%. This has contributed to a 1 year total shareholder return above 400%, indicating strong recent momentum off an extended rerating.
If you are looking beyond Viasat to other satellite and space related opportunities, this is a useful moment to scan the sector using the 35 power grid technology and infrastructure stocks
With Viasat shares up sharply and recent returns very large over 1 year, the key question now is simple: is the stock still undervalued after this rerating, or is the market already pricing in future growth?
Most Popular Narrative: 12.2% Undervalued
Viasat's most followed valuation narrative places fair value at $94.56 per share, above the last close of $83.06, which puts recent price moves into sharper context.
The focus on operational efficiency, portfolio review, and progressing integration with Inmarsat, in addition to CapEx peaking with the ViaSat-3 program, sets up Viasat for positive free cash flow inflection, deleveraging, and earnings improvement as major investment cycles wind down.
Want to see what sits behind that fair value uplift for Viasat? The narrative leans on measured revenue growth, margin repair, and a richer future earnings multiple. The exact mix of those three is what really moves the needle.
Result: Fair Value of $94.56 (UNDERVALUED)
Have a read of the narrative in full and understand what's behind the forecasts.
However, the Viasat narrative still hinges on heavy capital spending and the risk that ViaSat-3 execution or competitive pressure will limit the payoff from its spectrum assets.
Find out about the key risks to this Viasat narrative.
Another View: Viasat Through The SWS DCF Lens
The popular narrative has Viasat trading about 12.2% below a $94.56 fair value, but the SWS DCF model tells a different story. On that cash flow view, the stock at $83.06 sits above an estimated value of $77.53, so it screens as overvalued rather than cheap.
This gap between a cash flow model that signals caution and a narrative that leans on richer multiples leaves a simple question for you: which set of assumptions feels more realistic for Viasat over the next few years?
Look into how the SWS DCF model arrives at its fair value.
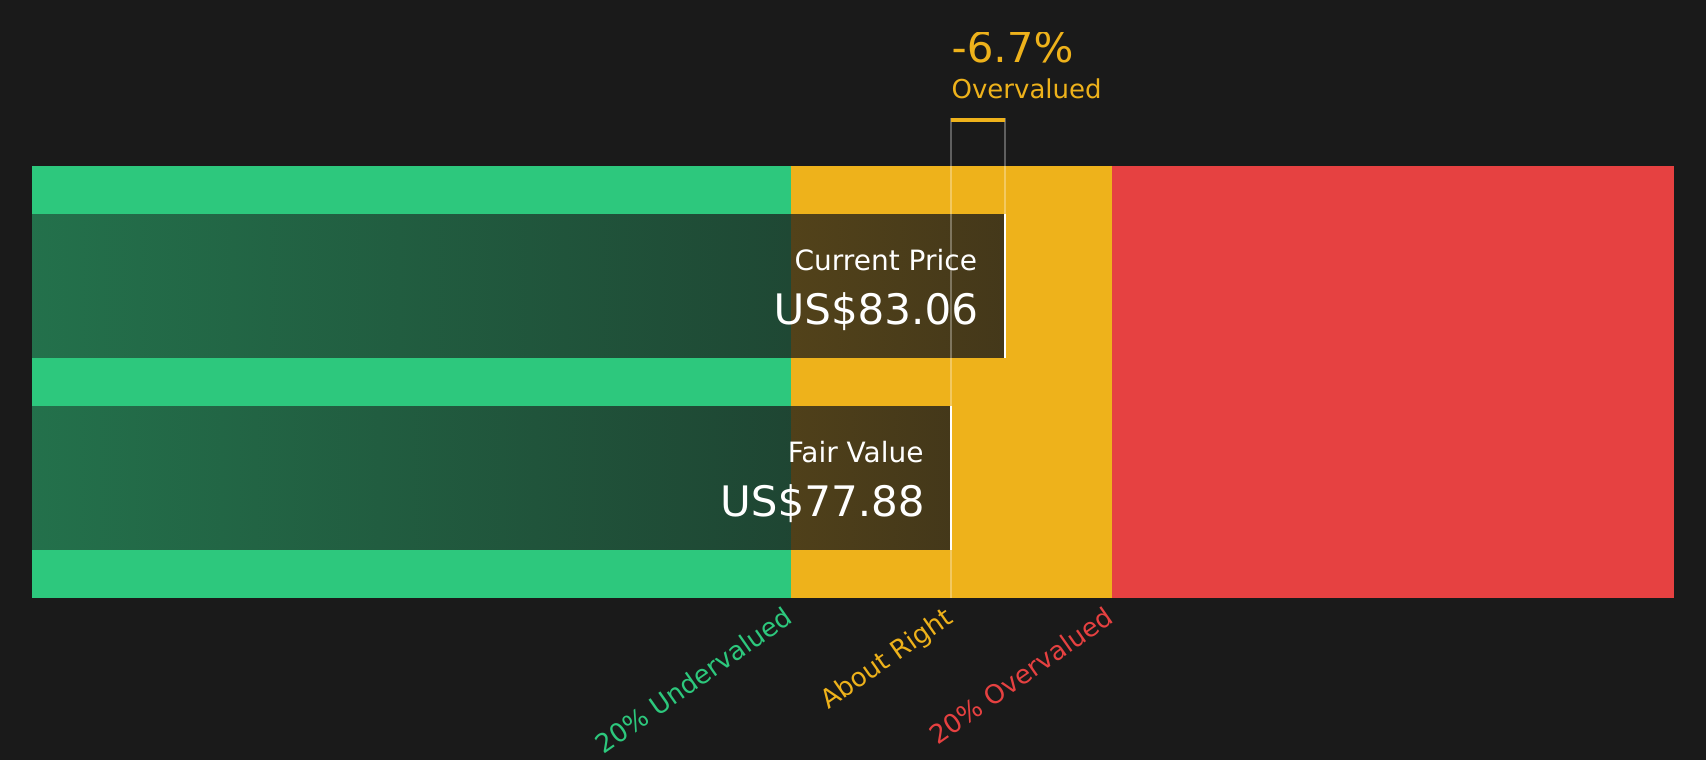
Simply Wall St performs a discounted cash flow (DCF) on every stock in the world every day (check out Viasat for example). We show the entire calculation in full. You can track the result in your watchlist or portfolio and be alerted when this changes, or use our stock screener to discover 43 high quality undervalued stocks. If you save a screener we even alert you when new companies match - so you never miss a potential opportunity.
Next Steps
The tension between a bullish Viasat narrative and a more cautious DCF view is clear. Move quickly to study the key risks and weigh the 3 important warning signs.
Looking For More Investment Ideas Beyond Viasat?
If you are serious about building a stronger portfolio alongside Viasat, do not stop here. Use the Simply Wall Street Screener to uncover focused, data driven ideas others might overlook.
- Target potential mispricings by scanning a curated list of companies that currently screen as 43 high quality undervalued stocks.
- Strengthen your income stream by reviewing stocks that qualify as 7 dividend fortresses with yields that may stand out against cash and bonds.
- Tighten your risk profile by concentrating on companies highlighted in the 75 resilient stocks with low risk scores that score well on resilience and balance sheet strength.
This article by Simply Wall St is general in nature. We provide commentary based on historical data and analyst forecasts only using an unbiased methodology and our articles are not intended to be financial advice. It does not constitute a recommendation to buy or sell any stock, and does not take account of your objectives, or your financial situation. We aim to bring you long-term focused analysis driven by fundamental data. Note that our analysis may not factor in the latest price-sensitive company announcements or qualitative material. Simply Wall St has no position in any stocks mentioned.
Have feedback on this article? Concerned about the content? Get in touch with us directly. Alternatively, email editorial-team@simplywallst.com