


Selective Insurance Group (SIGI) has been dropped from several Russell growth indices, including the Russell 2000 Growth Defensive and Russell 3000 Growth benchmarks. This shift can influence index-linked fund flows and trading activity.
See our latest analysis for Selective Insurance Group.
Despite being dropped from several Russell growth indices, Selective Insurance Group’s recent trading has been strong, with a 30 day share price return of 16.39% and a 90 day share price return of 30.20%. The 1 year total shareholder return stands at 18.38%, suggesting momentum has been building over both shorter and longer periods.
If this kind of index reshuffle has you thinking about where else growth stories could emerge, it may be worth scanning opportunities in 20 top founder-led companies
So, with Selective Insurance Group trading around US$100.15, sitting at a 44% discount to one intrinsic value estimate yet above the average analyst target, is there still an opportunity here or is the market already pricing in future growth?
Most Popular Narrative: 8.4% Overvalued
Compared with the most followed narrative fair value of $92.43, Selective Insurance Group at $100.15 sits above that estimate and invites closer scrutiny of the drivers behind that gap.
The company's ongoing focus and investments in operational efficiency, including data analytics, digital claims management, and underwriting tools, are expected to drive improved combined ratios and support margin expansion, leading to long term net margin and earnings growth.
Curious what kind of revenue path, margin profile, and earnings multiple have to line up to justify that valuation gap? The narrative relies on steady top line assumptions, a thicker profit margin, and a lower earnings multiple than many peers. The combination of these inputs is what really moves the fair value.
Result: Fair Value of $92.43 (OVERVALUED)
Have a read of the narrative in full and understand what's behind the forecasts.
However, Selective Insurance Group’s heavy tilt toward casualty lines and ongoing reserve uncertainty, along with higher expense pressure, could still challenge the efficiency and growth narrative investors are testing.
Find out about the key risks to this Selective Insurance Group narrative.
Another View on Selective Insurance Group’s Valuation
While the most followed narrative suggests Selective Insurance Group is 8.4% overvalued versus a US$92.43 fair value, the SWS DCF model points in the opposite direction, with an estimated future cash flow value of US$179.97, or a 44.4% gap below the current share price.
These two methods produce very different answers, so which set of assumptions do you find more convincing for how SIGI’s earnings and cash flows might evolve?
Look into how the SWS DCF model arrives at its fair value.
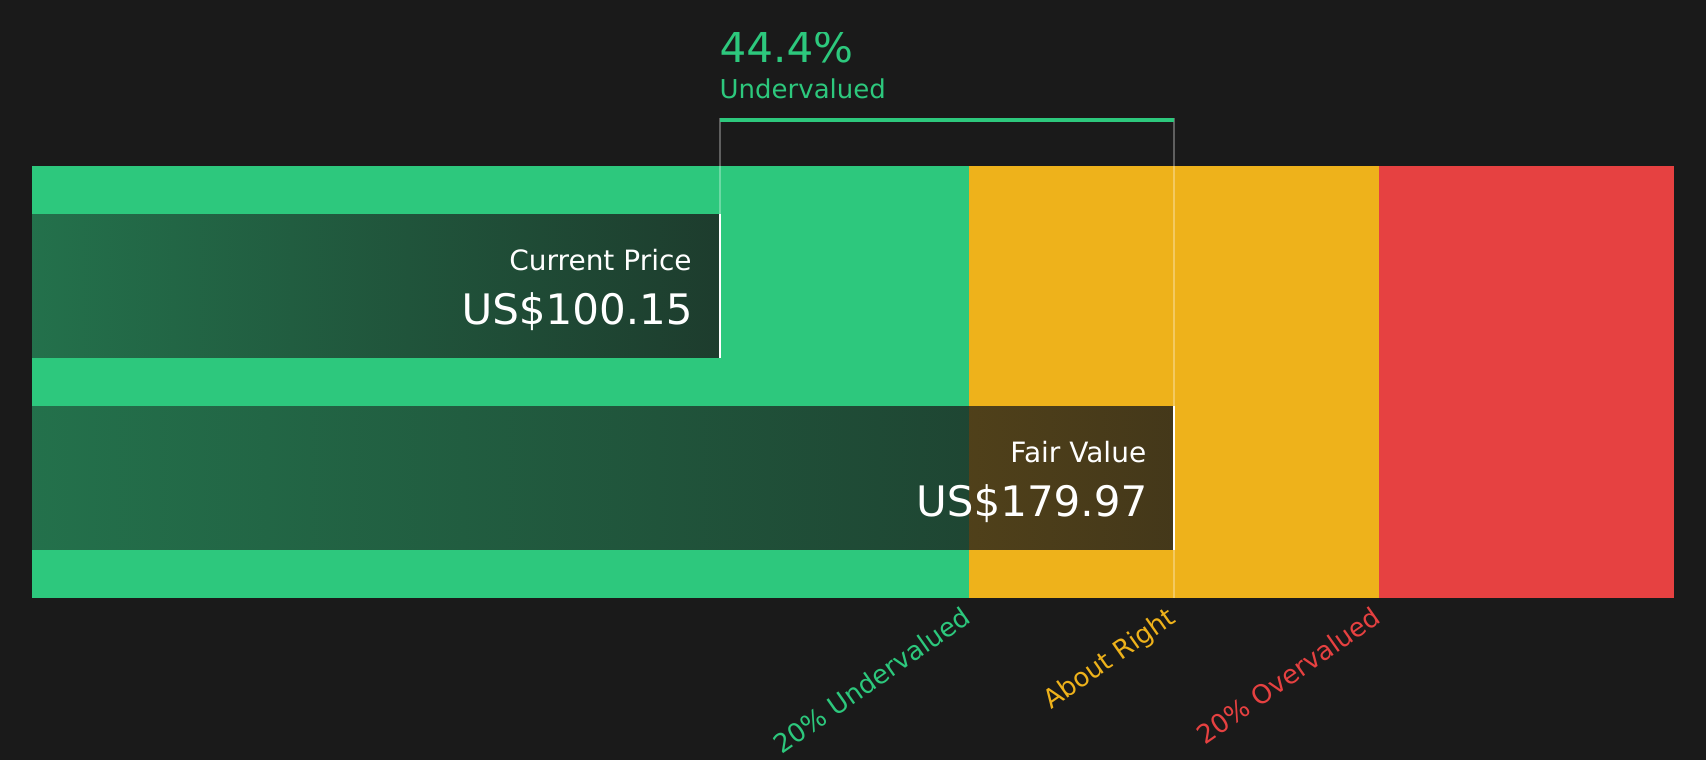
Simply Wall St performs a discounted cash flow (DCF) on every stock in the world every day (check out Selective Insurance Group for example). We show the entire calculation in full. You can track the result in your watchlist or portfolio and be alerted when this changes, or use our stock screener to discover 43 high quality undervalued stocks. If you save a screener we even alert you when new companies match - so you never miss a potential opportunity.
Next Steps
If the conflicting signals on Selective Insurance Group leave you undecided, that is exactly the point where closer work with the numbers helps. Take a focused look at what investors currently see as the key positives by reviewing the 4 key rewards.
Looking for more investment ideas beyond Selective Insurance Group?
If the mixed valuation signals on Selective Insurance Group have sharpened your curiosity, now is the time to widen your search using the Simply Wall St Screener.
- Spot potential mispricings early by checking companies that currently screen as 43 high quality undervalued stocks.
- Strengthen your watchlist with businesses that appear resilient in tougher conditions through the 75 resilient stocks with low risk scores.
- Hunt for future standouts before the crowd notices them by using the screener containing 18 high quality undiscovered gems.
This article by Simply Wall St is general in nature. We provide commentary based on historical data and analyst forecasts only using an unbiased methodology and our articles are not intended to be financial advice. It does not constitute a recommendation to buy or sell any stock, and does not take account of your objectives, or your financial situation. We aim to bring you long-term focused analysis driven by fundamental data. Note that our analysis may not factor in the latest price-sensitive company announcements or qualitative material. Simply Wall St has no position in any stocks mentioned.
Have feedback on this article? Concerned about the content? Get in touch with us directly. Alternatively, email editorial-team@simplywallst.com