


Titan America (TTAM) has been added to several Russell value and small cap benchmarks, including the Russell 2000 Value and Russell 3000 Value, which has drawn attention to the stock’s profile among U.S. value-focused indices.
See our latest analysis for Titan America.
Titan America’s recent inclusion in multiple Russell value indices has come on the back of a 30 day share price return of 13.88% and a 90 day share price return of 20.68%, while its 1 year total shareholder return of 45.71% points to strong longer term momentum from a latest share price of $18.21, despite some shorter term share price weakness over the past week.
If Titan America’s move into value indices has you thinking about what else is reshaping construction and infrastructure, it could be a good moment to scout 35 power grid technology and infrastructure stocks
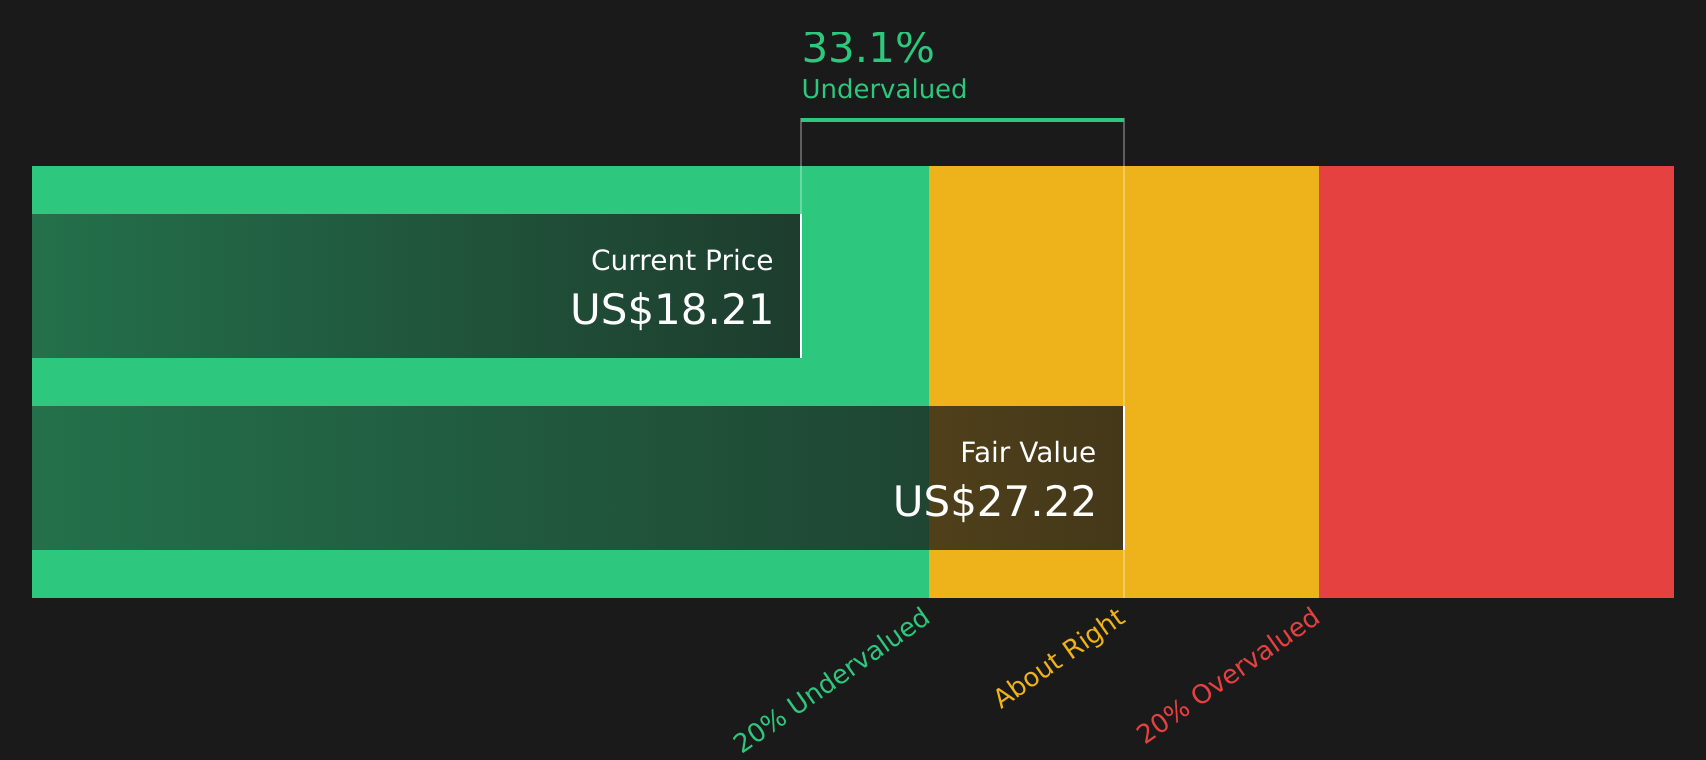
With Titan America trading at $18.21, sitting at a 33.11% intrinsic discount and carrying a value score of 4, the key question is whether this reflects genuine undervaluation or whether the market is already factoring in expectations about future growth.
Most Popular Narrative: 21.4% Overvalued
With Titan America last closing at $18.21 against a most popular fair value estimate of $15.00, the narrative frames current pricing as richer than its fundamentals, using a discount rate of 8.68% to bring future cash flows back to today.
The heavy reliance on large infrastructure and private nonresidential projects, including data centers and major environmental works, leaves Titan America exposed if public funding cycles slow or reshoring and reindustrialization project pipelines moderate. This would pressure volumes and revenue concentration from these categories.
Want to see what is baked into that $15.00 fair value for Titan America? The core of this narrative is a specific revenue glide path, firmer profit margins and a future earnings multiple that needs to reset lower from today. Curious how those moving parts combine to justify a lower valuation than the current share price suggests?
Result: Fair Value of $15.00 (OVERVALUED)
Have a read of the narrative in full and understand what's behind the forecasts.
However, if infrastructure and data center spending in Florida and the Mid Atlantic stays robust, Titan America could see steadier volumes and pricing than this bearish narrative assumes.
Find out about the key risks to this Titan America narrative.
Another View on Titan America’s Valuation
The popular narrative pegs Titan America as 21.4% overvalued at $18.21 versus a $15.00 fair value, but the SWS DCF model points in the opposite direction, with a future cash flow value of $27.22. That gap suggests either the narrative is too cautious or the cash flow assumptions are too generous. Which side feels more realistic to you?
To see how this cash flow based view is built up from revenue, margins and discount rates, Look into how the SWS DCF model arrives at its fair value.
Next Steps
With sentiment split between overvaluation worries and a richer DCF fair value, it makes sense to act quickly by reviewing the underlying data yourself and pressure testing the assumptions. To see what those positives look like in more detail, take a closer look at the 3 key rewards.
Looking for more investment ideas beyond Titan America?
Do not stop at Titan America. Broaden your watchlist now so you are not relying on a single story when there are other opportunities worth assessing.
- Chase potential mispricing by scanning for compelling value opportunities with the 44 high quality undervalued stocks.
- Build a more resilient core by focusing on companies with the solid balance sheet and fundamentals stocks screener (47 results).
- Hunt for lesser known opportunities that still show strong fundamentals using the screener containing 18 high quality undiscovered gems.
This article by Simply Wall St is general in nature. We provide commentary based on historical data and analyst forecasts only using an unbiased methodology and our articles are not intended to be financial advice. It does not constitute a recommendation to buy or sell any stock, and does not take account of your objectives, or your financial situation. We aim to bring you long-term focused analysis driven by fundamental data. Note that our analysis may not factor in the latest price-sensitive company announcements or qualitative material. Simply Wall St has no position in any stocks mentioned.
Have feedback on this article? Concerned about the content? Get in touch with us directly. Alternatively, email editorial-team@simplywallst.com