


- In late June 2026, MYR Group Inc. was removed from the Russell 2000 Dynamic Index, a benchmark followed by various index-linked investors.
- This index removal can alter ownership patterns and trading activity, as funds that replicate the benchmark adjust their holdings in MYR Group.
- We'll now explore how MYR Group's removal from the Russell 2000 Dynamic Index may influence its investment narrative and future positioning.
Invest in the nuclear renaissance through our list of 89 elite nuclear energy infrastructure plays powering the global AI revolution.
MYR Group Investment Narrative Recap
To own MYR Group today, you need to believe in sustained demand for grid, data center, and infrastructure work, supported by its sizeable backlog and recent earnings strength. The Russell 2000 Dynamic Index removal is more about technical flows than fundamentals, so it may affect short term trading but does not materially change the key near term catalyst of converting backlog into profitable revenue, or the biggest risk around project mix, labor costs, and lumpy C&I backlog.
The most relevant recent development is MYR Group’s record Q1 2026 results, with US$1,000.38 million in sales and US$46.8 million in net income. These figures underscore how current projects and margins are supporting earnings at a time when index related selling could add share price volatility, sharpening the focus on whether the company can keep winning and executing contracts at attractive terms as competition, labor costs, and capex needs evolve.
Yet beneath the strong quarter and index changes, there is a risk investors should be aware of if labor costs rise and C&I backlog remains volatile...
Read the full narrative on MYR Group (it's free!)
MYR Group's narrative projects $5.2 billion revenue and $253.1 million earnings by 2029.
Uncover how MYR Group's forecasts yield a $455.00 fair value, a 3% upside to its current price.
Exploring Other Perspectives
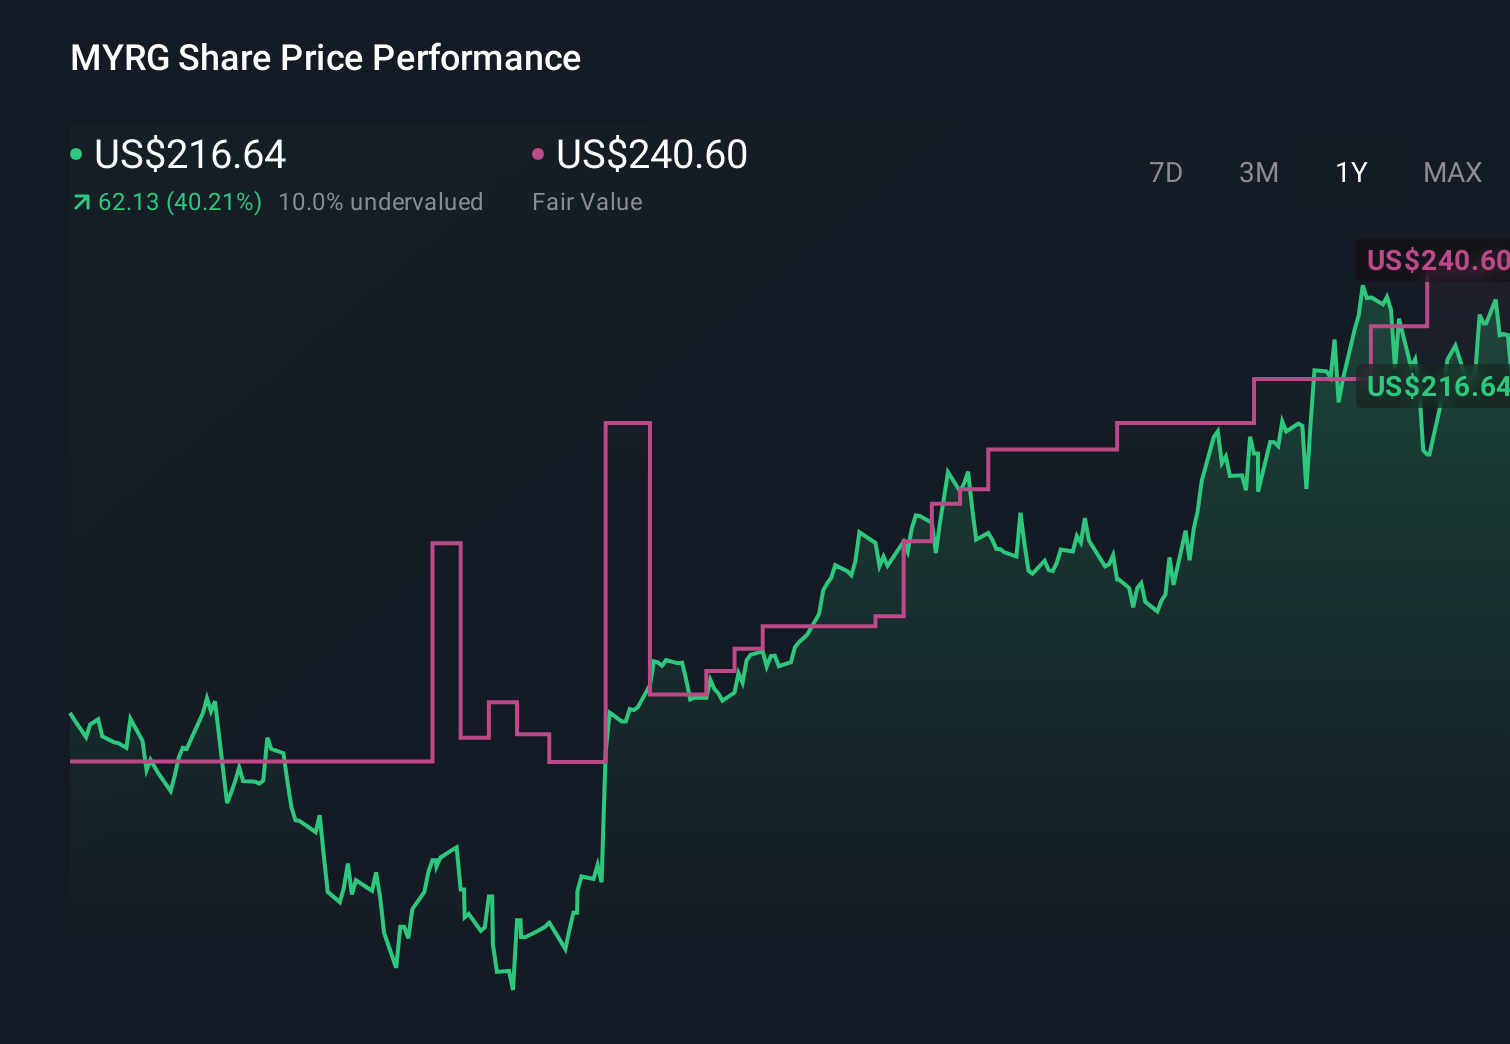
Some of the lowest ranked analysts were already assuming MYR Group would reach about US$5.1 billion of revenue and US$249.0 million of earnings, yet even they worry that very large grid and data center projects starting later than expected could magnify the impact of index related selling and turn today’s optimism into a tougher earnings path.
Explore 3 other fair value estimates on MYR Group - why the stock might be worth as much as $455.00!
Reach Your Own Conclusion
Don't just follow the ticker - dig into the data and build a conviction that's truly your own.
- A great starting point for your MYR Group research is our analysis highlighting 2 key rewards and 1 important warning sign that could impact your investment decision.
- Our free MYR Group research report provides a comprehensive fundamental analysis summarized in a single visual - the Snowflake - making it easy to evaluate MYR Group's overall financial health at a glance.
Seeking Other Investments?
Our daily scans reveal stocks with breakout potential. Don't miss this chance:
- Outshine the giants: these 15 early-stage AI stocks could fund your retirement.
- Uncover the next big thing with 20 elite penny stocks that balance risk and reward.
- The future of work is here. Discover the 29 top robotics and automation stocks leading the charge in AI-driven automation and industrial transformation.
This article by Simply Wall St is general in nature. We provide commentary based on historical data and analyst forecasts only using an unbiased methodology and our articles are not intended to be financial advice. It does not constitute a recommendation to buy or sell any stock, and does not take account of your objectives, or your financial situation. We aim to bring you long-term focused analysis driven by fundamental data. Note that our analysis may not factor in the latest price-sensitive company announcements or qualitative material. Simply Wall St has no position in any stocks mentioned.
Have feedback on this article? Concerned about the content? Get in touch with us directly. Alternatively, email editorial-team@simplywallst.com