


TGS (OB:TGS) is back in focus after management issued second quarter 2026 revenue guidance and closed the sale of its North American well data products business, giving investors fresh information on operations and balance sheet priorities.
See our latest analysis for TGS.
TGS shares trade at NOK132.0, and recent news on revenue guidance and the A2D sale comes after a 40.43% year to date share price return and a 70.75% 1 year total shareholder return. This suggests momentum has been building despite some shorter term pullbacks.
If you are looking beyond TGS to other companies linked to energy infrastructure and electrification, this could be a good moment to review 34 power grid technology and infrastructure stocks.
After a sharp 1 year move and a fresh cash injection from the A2D sale, it is worth asking how much of TGS’s rerating reflects stronger core operations versus investors simply paying up on sentiment, and what that implies for valuation going forward.
Most Popular Narrative: 13.6% Undervalued
The most followed narrative on TGS currently points to a fair value of NOK152.77 versus the last close at NOK132.00, framing the recent rally within a still implied discount.
The company is expanding its dataset coverage in high-potential regions such as Brazil's Equatorial Margin, Argentina's Malvinas, and the Gulf of Mexico, positioning itself to benefit from frontier exploration trends as supermajors invest in securing future energy supplies, which should support top-line growth and library value realization.
Want to understand why this narrative supports a higher fair value for TGS? The core hinges on faster revenue growth, sharply higher margins and a future earnings profile that assumes a very different profit mix from today.
Result: Fair Value of NOK152.77 (UNDERVALUED)
Have a read of the narrative in full and understand what's behind the forecasts.
However, this TGS narrative still leans heavily on oil price sensitive spending and concentrated large contracts, so weaker sector budgets or delayed projects could quickly undermine these assumptions.
Find out about the key risks to this TGS narrative.
Another View: TGS Through a Sales Multiple Lens
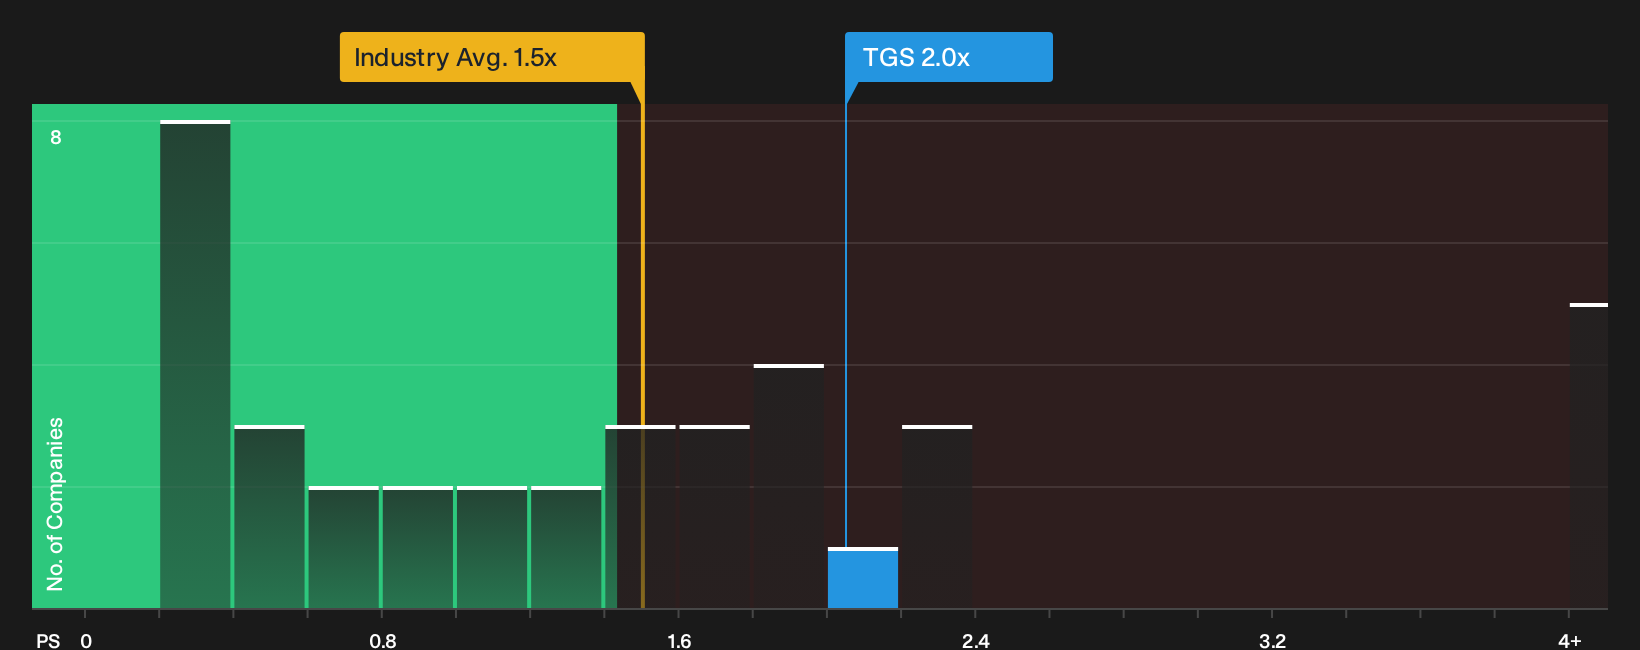
While the SWS DCF model suggests TGS is trading at a large discount to estimated future cash flows, the picture looks less clear when you just compare today’s sales. TGS trades on a P/S of 2x, above both peers at 1.4x and the Norwegian Energy Services average at 1.5x, even if the fair ratio points to 3.3x. For you, that mix of apparent upside on the fair ratio and richer pricing versus peers raises a simple question: how much premium are you comfortable paying for the current story around TGS?
See what the numbers say about this price — find out in our valuation breakdown.
Next Steps
With TGS, the story so far mixes confidence and caution, so it makes sense to move quickly, review the underlying data and decide where you stand by checking the balance of 2 key rewards and 1 important warning sign.
Looking for more ideas beyond TGS?
If TGS has your attention, do not stop there. Use this moment to broaden your watchlist with stocks that match the kind of risk and return profile you actually want.
- Target value first and see how many companies currently trade at a discount by starting with the 213 high quality undervalued stocks.
- Focus on resilience and cut down on unpleasant surprises by filtering for companies in the 292 resilient stocks with low risk scores.
- Hunt for potential future leaders that are not widely followed yet by scanning the screener containing 499 high quality undiscovered gems.
This article by Simply Wall St is general in nature. We provide commentary based on historical data and analyst forecasts only using an unbiased methodology and our articles are not intended to be financial advice. It does not constitute a recommendation to buy or sell any stock, and does not take account of your objectives, or your financial situation. We aim to bring you long-term focused analysis driven by fundamental data. Note that our analysis may not factor in the latest price-sensitive company announcements or qualitative material. Simply Wall St has no position in any stocks mentioned.
Have feedback on this article? Concerned about the content? Get in touch with us directly. Alternatively, email editorial-team@simplywallst.com