


- In July 2026, Tradeweb Markets Inc. reported that June 2026 total trading volume reached $69.7 trillion, with average daily volume up very large year-over-year to $3.2 trillion and second-quarter trading volume at $194.2 trillion.
- The update also highlighted preliminary average variable fees of US$2.14 per million traded and US$98.6 million of fixed fees across key asset classes, underscoring how volume growth is converting into meaningful fee generation.
- We’ll now examine how this surge in June and second-quarter trading activity might influence Tradeweb’s existing investment narrative.
This technology could replace computers: discover 26 stocks that are working to make quantum computing a reality.
Tradeweb Markets Investment Narrative Recap
To own Tradeweb, you generally have to believe that bond and derivatives trading will keep shifting onto electronic platforms and that Tradeweb can stay a key venue for that flow. The June and second quarter 2026 volume surge confirms strong usage in the near term, but it does not fully resolve the biggest short term questions around pricing pressure on fees per million and whether voice trading in volatile markets could still cap share gains.
The recent launch of TARA, Tradeweb’s AI Research Assistant, feels particularly relevant here. As volumes scale, tools that turn trading data into real time intelligence and tighter workflow integration may help support both usage and higher value services. That matters directly for the current catalyst of growing electronic adoption across credit and rates, while also speaking to the risk that competition and client connectivity options could otherwise pressure Tradeweb’s role in the trading stack.
Yet beneath the strong volume headlines, investors should be aware of how fee mix and client behavior could still affect...
Read the full narrative on Tradeweb Markets (it's free!)
Tradeweb Markets' narrative projects $2.9 billion revenue and $1.2 billion earnings by 2029.
Uncover how Tradeweb Markets' forecasts yield a $134.86 fair value, a 38% upside to its current price.
Exploring Other Perspectives
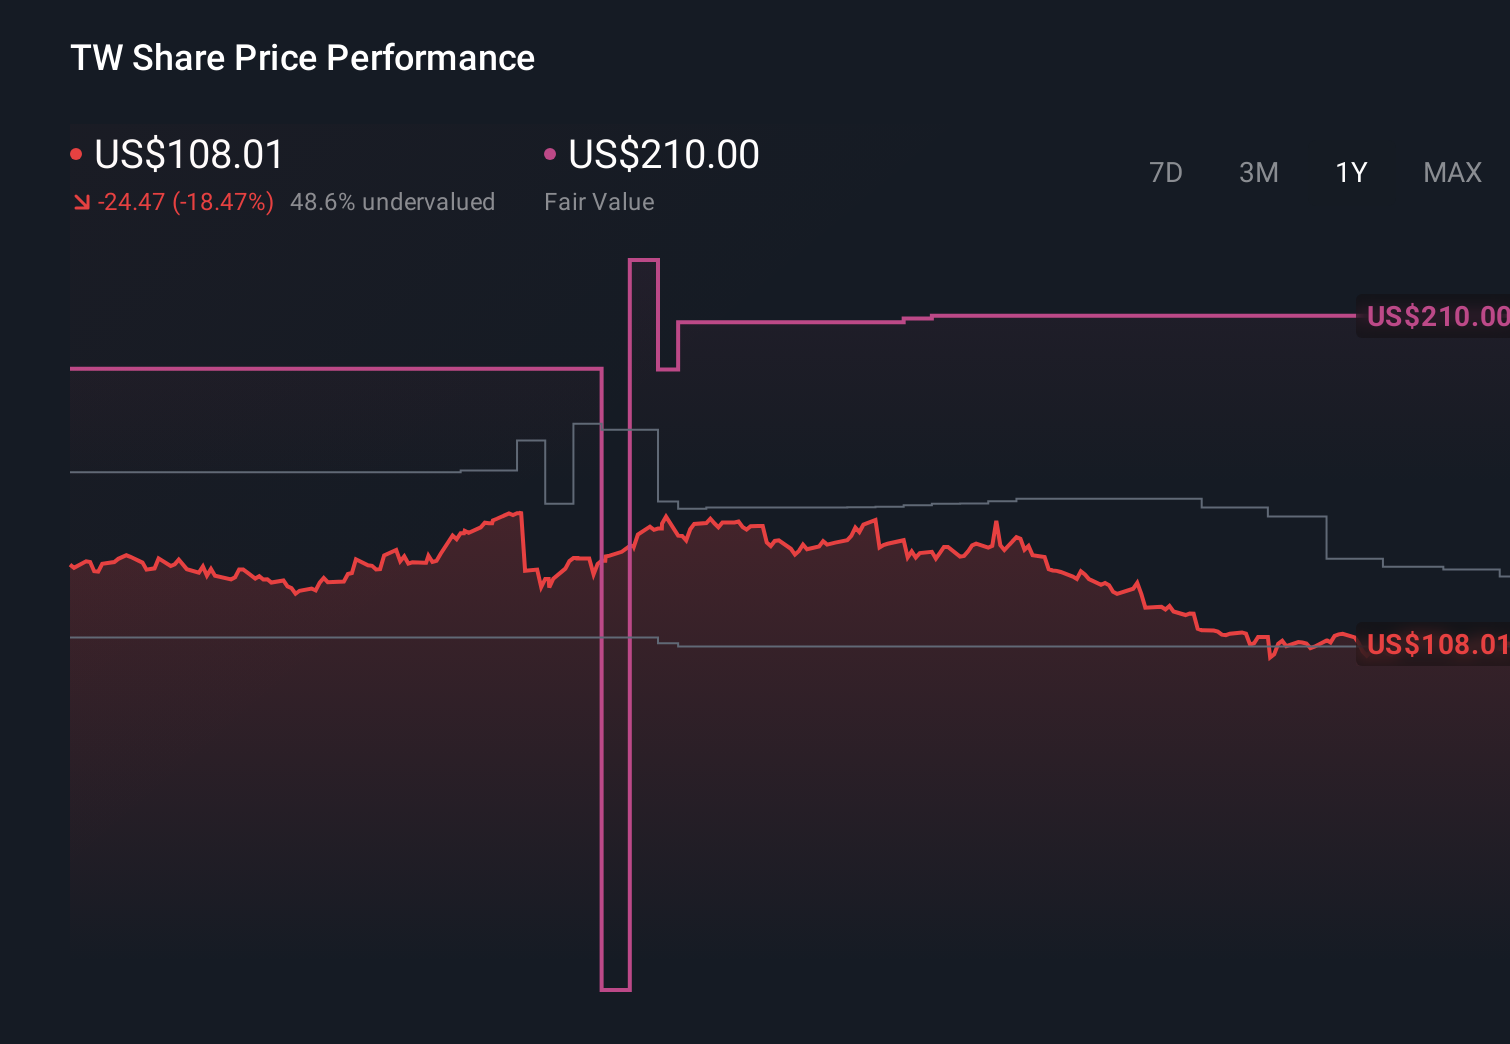
While consensus focused on steady growth, the most optimistic analysts were already assuming about US$3.1 billion in 2029 revenue and US$1.2 billion in earnings, so June’s volume spike may either support that bullish electronification story or highlight how client concentration and new technologies could still make those targets harder to reach.
Explore 4 other fair value estimates on Tradeweb Markets - why the stock might be worth as much as 82% more than the current price!
Decide For Yourself
Don't just follow the ticker - dig into the data and build a conviction that's truly your own.
- A great starting point for your Tradeweb Markets research is our analysis highlighting 3 key rewards that could impact your investment decision.
- Our free Tradeweb Markets research report provides a comprehensive fundamental analysis summarized in a single visual - the Snowflake - making it easy to evaluate Tradeweb Markets' overall financial health at a glance.
Looking For Alternative Opportunities?
Our daily scans reveal stocks with breakout potential. Don't miss this chance:
- Capitalize on the AI infrastructure supercycle with our selection of the 52 best 'picks and shovels' of the AI gold rush converting record-breaking demand into massive cash flow.
- We've uncovered the 9 dividend fortresses yielding 5%+ that don't just survive market storms, but thrive in them.
- The future of work is here. Discover the 32 top robotics and automation stocks leading the charge in AI-driven automation and industrial transformation.
This article by Simply Wall St is general in nature. We provide commentary based on historical data and analyst forecasts only using an unbiased methodology and our articles are not intended to be financial advice. It does not constitute a recommendation to buy or sell any stock, and does not take account of your objectives, or your financial situation. We aim to bring you long-term focused analysis driven by fundamental data. Note that our analysis may not factor in the latest price-sensitive company announcements or qualitative material. Simply Wall St has no position in any stocks mentioned.
Have feedback on this article? Concerned about the content? Get in touch with us directly. Alternatively, email editorial-team@simplywallst.com